Figures & data
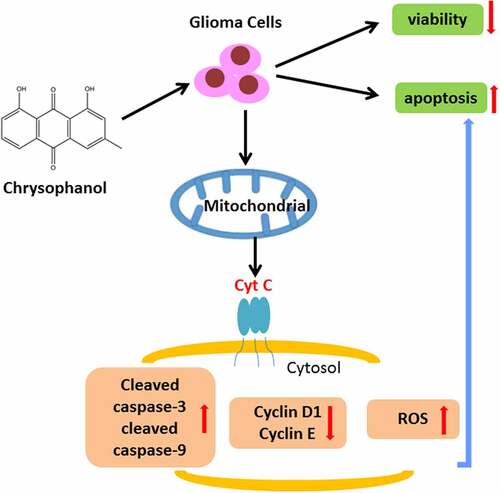
Figure 1. Chrysophanol suppressed cell viability while promoting cell apoptosis in glioma cells. (a) The structural formula of chrysophanol. (b) Cell viability at 48 h of U251 and SHG-44 cells was detected by 3-(4,5-Dimethyl-2-Thiazolyl)-2,5-Diphenyl Tetrazolium Bromide (MTT) assay after treatment with different concentration of chrysophanol. (c) Apoptosis rates of U251 and SHG-44 cells were assessed by Annexin V-FITC Apoptosis Detection Kit with flow cytometry after treatment with different concentration of chrysophanol. (d) Representative images of cell apoptosis in U251 and SHG-44 cells through Annexin V-FITC Apoptosis Detection Kit with flow cytometry after treatment with different concentration of chrysophanol. *p < 0.05, *** p < 0.001 vs. Control group. All experiments were repeated independently at least three times. Data were expressed as the means ± standard deviation
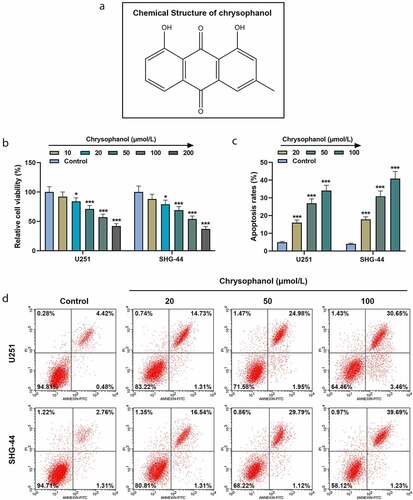
Figure 2. Chrysophanol induced cell cycle arrest and increased Cytosol Cyt C expression in glioma cells. (a) Cell cycle of U251 and SHG-44 cells was tested by flow cytometry after treatment with different concentration of chrysophanol. (b) Representative images of cell cycle in U251 and SHG-44 cells using flow cytometry after treatment with different concentration of chrysophanol. (c) Representative images of Cytosol Cyt C protein bands through western blot after treatment with different concentration of chrysophanol. β-actin was used as a loading control. (d) Cytosol Cyt C protein expression levels of U251 and SHG-44 cells were detected by western blot after treatment with different concentration of chrysophanol. β-actin was used as a loading control. *p < 0.05, **p < 0.01, *** p < 0.001 vs. Control group. All experiments were repeated independently at least three times. Data were expressed as the means ± standard deviation
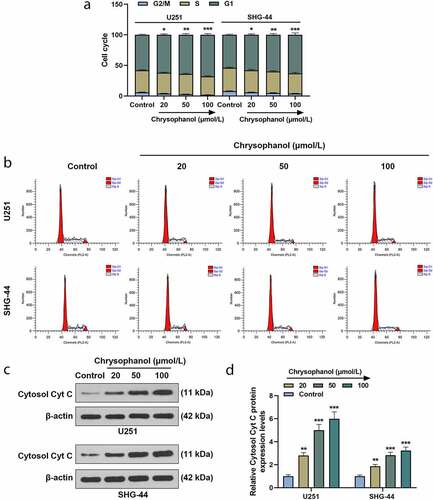
Figure 3. Chrysophanol increased cleaved caspase-3 and cleaved caspase-9 expressions as well as reactive oxygen species (ROS) accumulation while decreasing Cyclin D1 and Cyclin E levels in glioma cells. (a and b) Representative images of protein bands (a) as well as protein expression levels of Cleaved caspase-3, cleaved caspase-9, Cyclin D1 and Cyclin E in U251 cells were detected by western blot after treatment with different concentrations of chrysophanol. β-actin was used as a loading control. (c and d) Representative images of protein bands (c) as well as protein expression levels of Cleaved caspase-3, cleaved caspase-9, Cyclin D1 and Cyclin E in SHG-44 cells were detected by western blot after treatment with different concentrations of chrysophanol. β-actin was used as a loading control. (e) Representative images of ROS detection by flow cytometry after treatment with different concentrations of chrysophanol. (f) Flurescence intensity in U251 and SHG-44 was evaluated by flow cytometry after treatment with different concentrations of chrysophanol. * p < 0.05, ** p < 0.01, *** p < 0.001 vs. Control group. All experiments were repeated independently at least three times. Data were expressed as the means ± standard deviation
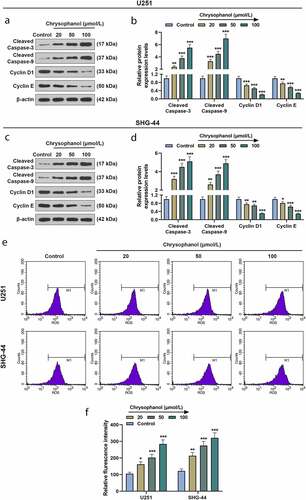
Figure 4. MitoTempo partly reversed the effect of chrysophanol on promoting reactive oxygen species (ROS) accumulation of mitochondria and inducing cell apoptosis in glioma cells. (a) Representative images of ROS detection by flow cytometry after treatment with chrysophanol and MitoTempo. (b) Flurescence intensity in U251 and SHG-44 was evaluated by flow cytometry after treatment with chrysophanol and MitoTempo. (c) Apoptosis rates of U251 and SHG-44 cells were assessed by Annexin V-FITC Apoptosis Detection Kit with flow cytometry after treatment with chrysophanol and MitoTempo. (d) Representative images of cell apoptosis in U251 and SHG-44 cells through Annexin V-FITC Apoptosis Detection Kit with flow cytometry after treatment with chrysophanol and MitoTempo. *** p < 0.001 vs. Control group; ^^^ p < 0.001 vs. Chrysophanol group; ## p < 0.01, ### p < 0.001 vs. MitoTempo group. All experiments were repeated independently at least three times. Data were expressed as the means ± standard deviation
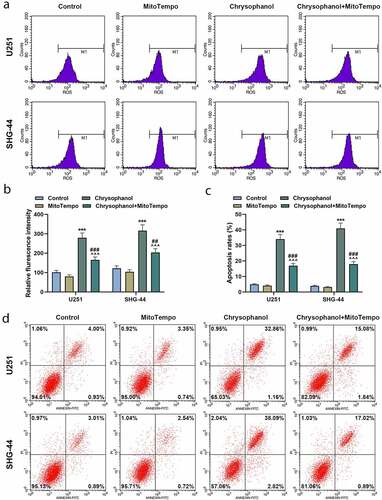
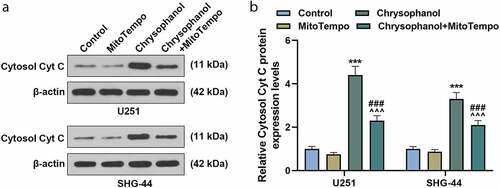
Figure 5. MitoTempo partly reversed the effect of chrysophanol on advancing leakage of Cytc C from mitochondria to cytosol in glioma cells. (a) Representative images of Cytosol Cyt C protein bands through western blot after treatment with chrysophanol and MitoTempo. β-actin was used as a loading control. (b) Cytosol Cyt C protein expression levels of U251 and SHG-44 cells were detected by western blot after treatment with chrysophanol and MitoTempo. β-actin was used as a loading control. *** p < 0.001 vs. Control group; ^^^ p < 0.001 vs. Chrysophanol group; ### p < 0.001 vs. MitoTempo group. All experiments were repeated independently at least three times. Data were expressed as the means ± standard deviation