
Figures & data
Figure 1. Identification of DEGs in SONFH. (a) Hierarchical clustering heat map of SONFH samples and control samples based on identified DEGs (50 genes shown). (b) Volcano plot of the DEGs between SONFH samples and control samples
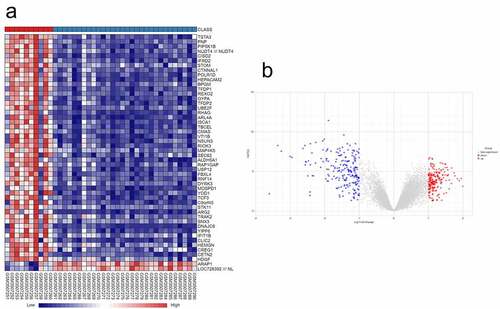
Table 1. The six most significant MCODE components were extracted from the PPI
Figure 2. Function enrichment analysis and PPI network construction. (a) GO functional enrichment analysis of BP. (b) GO functional enrichment analysis of CC. (c) GO functional enrichment analysis of MF. (d) KEGG pathway analyses results of the DEGs. (e) The PPI network of the DEGs. (f) The six most significant modules were obtained from the PPI network
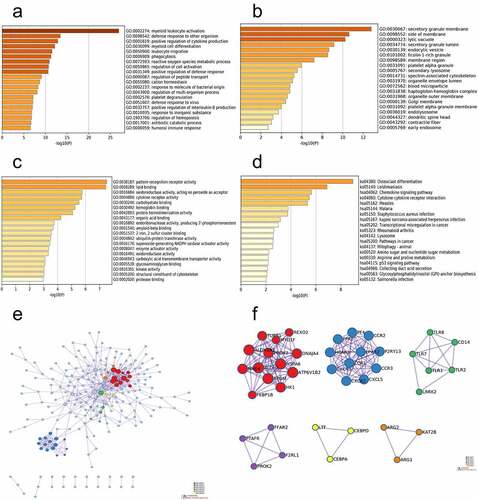
Figure 3. The differences in immune cell infiltration between SONFH and normal controls. (a) The relative percentage of 24 subpopulations of immune cells in 40 samples from the GSE123568 dataset. (b) Correlation analyses of the 24 subpopulations of immune cells estimated in 40 samples from GSE123568. (c) Heat map of the 24 subpopulations of immune cells estimated in 40 samples from GSE123568. (d) The differences in immune cell infiltration between SONFH patients and normal controls (*p values < 0.05 were considered statistically significant)
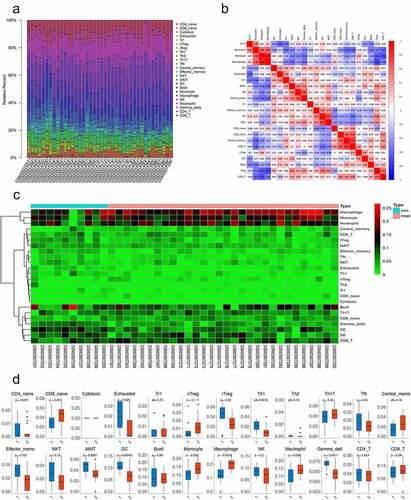
Figure 4. The 10 most highly expressed hub genes in the PPI network as confirmed with RT-PCR. (a) The 10 most highly expressed hub genes in the PPI network as determined by cytoHubba. (b) RT-PCR validation of the hub genes in SONFH and normal controls. All experiments were performed in triplicate, and the results are presented as the means ± SD. (*p < 0.05)
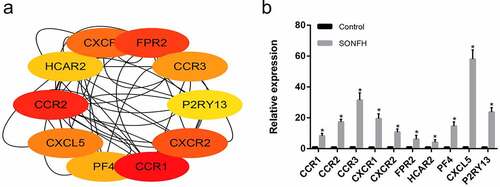
Table 2. The top 10 compounds with activity against SONFH as predicted via connectivity map
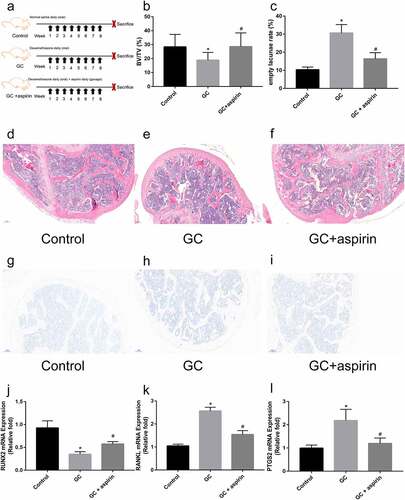
Figure 5. Identification of the therapeutic effect of aspirin in GC-induced ONFH. (a) Schematic diagram of the treatment of different groups of mice. H&E staining of representative femoral heads in each group. (b) Bone volume/total volume ration (BV/TV) in each group. (c) Empty lacunae rate in each group. (d-f) H&E staining of representative femoral heads in each group (scale bar = 100 μm). (g-i) TRAP staining of representative femoral heads in each group (scale bar = 100 μm). (j-l) Relative Runx2, RANKL and PTGS2 mRNA expression in femoral heads in each group. All experiments were performed in triplicate, and the results are presented as the means ± SD. (*p < 0.05 versus the control; #p < 0.05 versus the GC)
Supplemental Material
Download ()Data availability statement
All the data in our study will be made available by the authors upon reasonable request. https://www.ncbi.nlm.nih.gov/geo/query/acc.cgi?acc=GSE123568