
Figures & data
Figure 1. Characteristics and differentiation of UCB-MSCs. (a) Immunophenotyping of UCB-MSCs. Analysis of MSC markers including CD105 and CD29, as well as hematopoietic markers CD34 and CD45 was performed by flow cytometry. (b) Adipogenic differentiation detected by Oil Red O staining. (c) Osteogenic differentiation detected by Alizarin Red staining. Scale bars: 50 µm. UCB-MSCs: umbilical cord blood mesenchymal stem cells
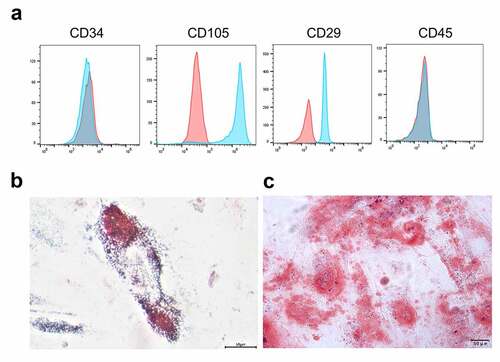
Figure 2. UCB-MSC-CM protects L02 cells against oxidative injury by miR-486-5p. (a) RT-qPCR was used to measure the expression of miR-486-5p in L02 cells after H2O2 stimulation and UCB-MSC-CM treatment. (b) CCK-8 assay was performed to detect the effects of UCB-MSC-CM after overexpression or downregulation of miR-486-5p on L02 cell proliferation. (c-d) Flow cytometry analysis revealed the effects of UCB-MSC-CM after overexpression or downregulation of miR-486-5p on L02 cell apoptosis. (e) Western blot analysis was performed to evaluate the influences of UCB-MSC-CM after overexpression or downregulation of miR-486-5p on proapoptotic proteins. (f) ELISA was conducted to measure the levels of inflammatory cytokines in each group. *P < 0.05
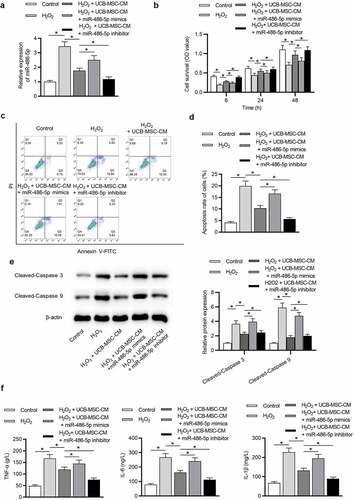
Figure 3. Downregulation of miR-486-5p ameliorates H2O2-induced L02 cell injury. (a) The expression of miR-486-5p in each group was determined by RT-qPCR. (b) Cell proliferation in each group was assessed by CCK-8. (c-d) Cell apoptosis in each group was detected by flow cytometry analysis. (e) The levels of proapoptotic proteins were measured using western blot analysis. (f) The levels of inflammatory cytokines were detected using ELISA. *P < 0.05
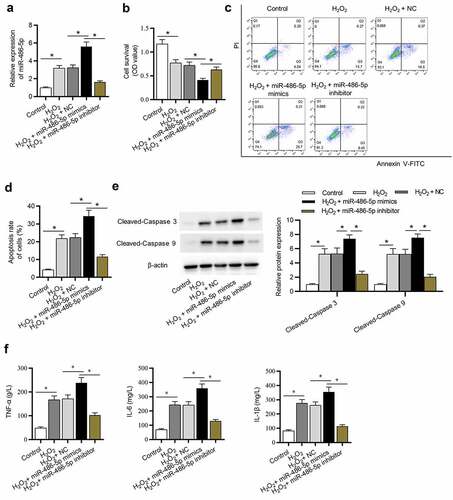
Figure 4. PIM1 is targeted by miR-486-5p. (a) Bioinformatics tools (microT, miRanda, PicTar and TargetScan) were used and Venn diagram exhibits 30 potential targets of miR-486-5p. (b) After miR-486-5p overexpression, the expression of targets was measured by RT-qPCR. (c) MiR-486-5p binding site in the wild type or mutant sequence of PIM1-3ʹUTR. (d) The binding capacity between miR-486-5p and PIM1 was confirmed by a luciferase reporter assay. (e) The expression of PIM1 in H2O2-treated cells transfected with miR-486-5p mimics or inhibitor was measured by RT-qPCR. (f) RT-qPCR was used to measure the expression of PIM1 in L02 cells after H2O2 stimulation and UCB-MSC-CM treatment. *P < 0.05
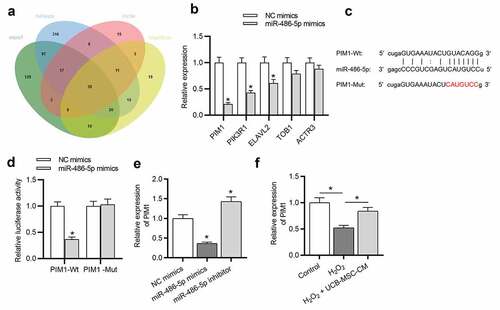
Figure 5. MiR-486-5p ameliorates H2O2-induced injury in L02 cells by upregulating PIM1. (a) PIM1 expression in cells transfected with si-control or si-PIM1 was analyzed by RT-qPCR. (b) Cell proliferation in each group was determined using CCK-8. (c) Cell apoptosis in each group was assessed by flow cytometry. (d) The levels of pro-apoptotic proteins were measured using western blot analysis. (e) The levels of inflammatory cytokines were detected by ELISA. *P < 0.05
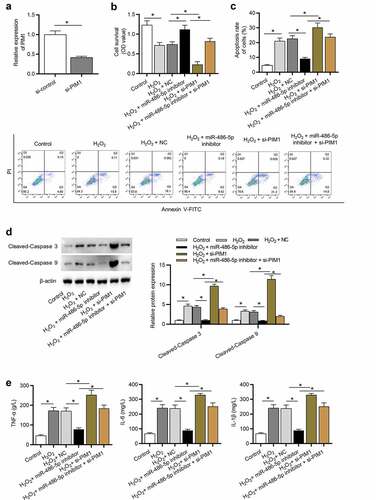
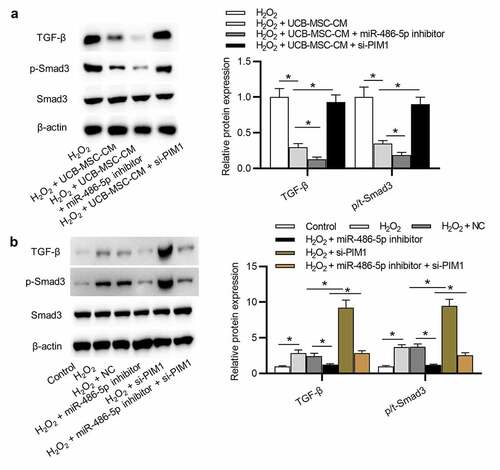
Figure 6. Downregulation of miR-486-5p inactivates the TGF-β/Smad pathway by regulation of PIM1. (a) The levels of TGF-β and phosphorylated (and total) Smad3 in L02 cells in 4 groups: H2O2; H2O2 + UCB-MSC-CM; H2O2 + UCB-MSC-CM + miR-486-5p inhibitor; H2O2 + UCB-MSC-CM + si-PIM1 were detected using western blot analysis. (b) The levels of TGF-β and phosphorylated (and total) Smad3 in L02 cells in 6 groups: Control; H2O2; H2O2 + NC; H2O2 + miR-486-5p inhibitor; H2O2 + si-PIM1; H2O2 + miR-486-5p inhibitor+si-PIM1 groups. *P < 0.05
Data availability statement
The datasets used during the current study are available from the corresponding author on reasonable request.