
Figures & data
Table 1. Details of the two GEO datasets used in this study
Figure 1. The differential expression of CKS2 in LGG tissues and non-tumor tissues. (a-c) Differential expression of CKS2 mRNA in LGG tissues and normal brain tissues in GEPIA2, GSE4290 and GSE16011 (*P < 0.05). (d) Differential expression of CKS2 protein in LGG tissues and adjacent normal brain tissues. (e) Representative images of the CKS2 protein expression in LGG tissues and adjacent normal brain tissues
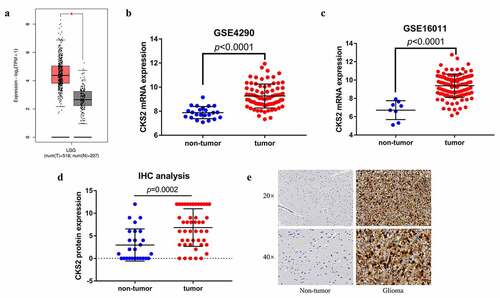
Figure 2. The differential expression of CKS2 in grade II and grade III gliomas. (a-d) Differential expression of CKS2 mRNA in grade II and grade III gliomas in TCGA, GSE4290, GSE16011 and CGGA. (e) Differential expression of CKS2 protein in grade II and grade III gliomas. (d) Representative images of the CKS2 protein expression in grade II and grade III gliomas
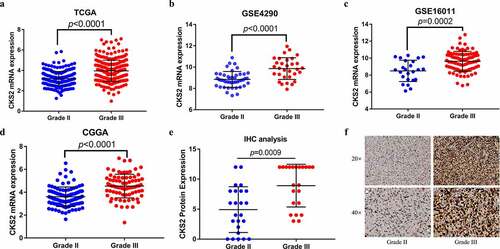
Figure 3. The correlation between the CKS2 mRNA expression and IDH1 mutation status in (a) TCGA database, (b) CGGA database and (c) TIMER2.0 database
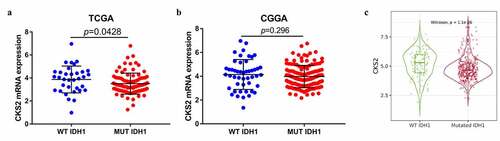
Figure 4. The association between the CKS2 and copy number alteration (CNA), or methylation in LGG. (a) CKS2 mRNA expression in different CNA groups. (b) Correlation analysis between CKS2 mRNA expression and CKS2 DNA methylation
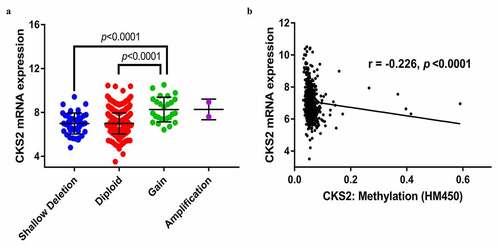
Figure 5. Survival prediction by the CKS2 gene in the TCGA-LGG and CGGA cohorts. (a-b) Kaplan-Meier (KM) survival analysis and time-dependent ROC analysis of CKS2 in LGG based on the TCGA-LGG cohort. (c-d) Kaplan-Meier (KM) survival analysis and time-dependent ROC analysis of CKS2 in LGG based on the CGGA cohort
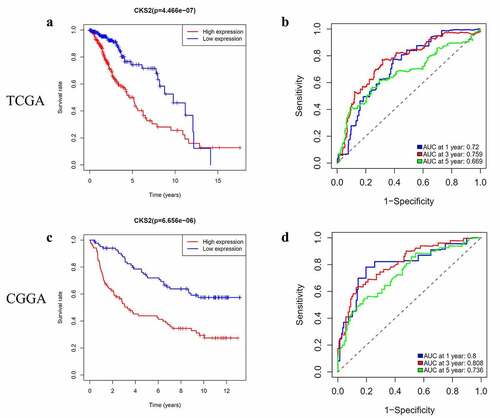
Figure 6. Time-dependent ROC analysis of CKS2, LGG grade and IDH1 mutation status in (a) the TCGA-LGG cohort and (b) the CGGA cohort
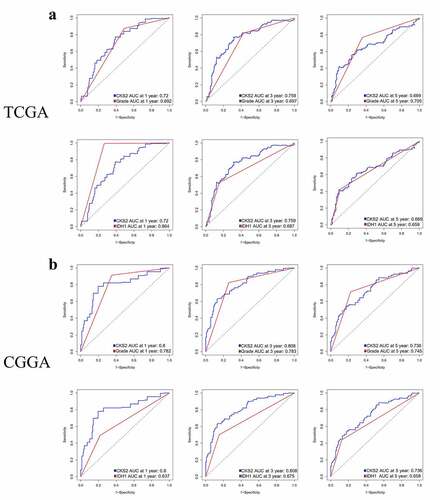
Table 2. Association between CKS2 expression and the clinical parameters in patients with LGG in TCGA-LGG cohort
Table 3. Association between CKS2 expression and the clinical parameters in patients with LGG in CGGA cohort
Table 4. Univariate analysis and multivariate analysis of the correlation of CKS2 expression with OS among LGG patients in TCGA-LGG cohort and CGGA cohort
Figure 7. Functional enrichment analysis of the differential expressed genes (DEGs) in the TCGA database. (a) Heatmap showing differentially expressed genes in the low and high CKS2 expression groups in LGG. (b-c) GO and KEGG enrichment analysis of the DEGs
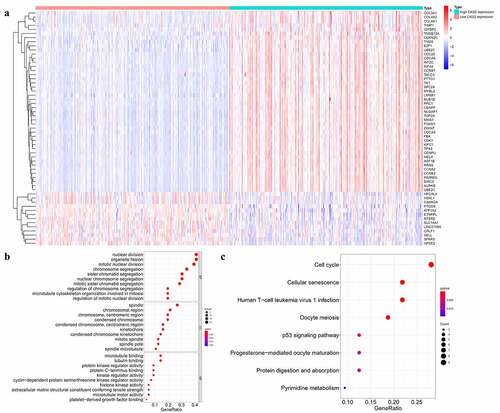
Table 5. Gene sets enriched in the high CKS2 expression group
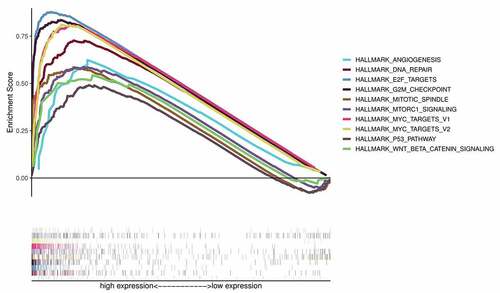
Figure 8. Gene Set Enrichment Analysis (GSEA) showing the signaling pathways enriched in phenotypes with overexpressed CKS2 in LGG
Supplemental Material
Download ()Data availability statement
All the data was downloaded from UCSC Xena (http://xena.ucsc.edu/public/), CGGA (http://www.cgga.org.cn/index.jsp), GEO (https://www.ncbi.nlm.nih.gov/geo/) and cBioPortal web server (https://www.cbioportal.org/study/summary?id=lgg_tcga). Besides, all the codes we used are available from the corresponding author for noncommercial purposes.