Figures & data
Figure 1. TREX1 is downregulated in the human melanoma cancer
(a): Survival plot of TREX1 expression level and alteration in melanoma patient survival. (b): Western blot analysis representing expression of TREX1 in human melanoma cancer cell lines. (c): RT-qPCR analysis representing expression of TREX1 in human melanoma cancer cell lines. (d): Western blot analysis representing expression of TREX1 in human melanoma clinical specimens. (e): RT-qPCR analysis representing expression of TREX1 in human melanoma clinical specimens. (* = p > 0.05)
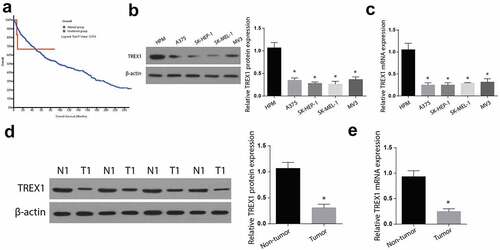
Figure 2. Overexpression of TREX1 induce apoptosis and decrease proliferation in human melanoma, cancerous cell lines
(a): Western blot analysis representing expression of TREX1 after transfection of TREX1 overexpression plasmid in SK-MEL-1 cell line. (b): RT-qPCR analysis representing expression of TREX1 after transfection of TREX1 overexpression plasmid in SK-MEL-1 cell line. (c): Western blot analysis representing expression of TREX1 after transfection of TREX1 overexpression plasmid in SK-HEP-1 cell line. (d): RT-qPCR analysis representing expression of TREX1 after transfection of TREX1 overexpression plasmid in SK-HEP-1 cell line. (e): Flow cytometry analysis representing the apoptosis rate after transfection of TREX1 overexpression plasmid in SK-MEL-1 cell line. (f): MTT analysis representing cell viability rate after transfection of TREX1 overexpression plasmid in SK-MEL-1 cell line. (g): Flow cytometry analysis representing apoptosis rate after transfection of TREX1 overexpression plasmid in SK-HEP-1 cell line. (h): MTT analysis representing cell viability rate after transfection of TREX1 overexpression plasmid in SK-HEP-1 cell line. (* = p > 0.05)
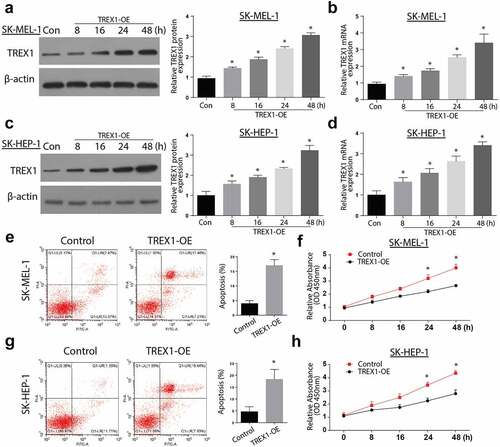
Figure 3. Overexpression of TREX1 activates the cGAS/STING pathway to induce apoptosis and decrease cell growth
(a): Western blot analysis representing expression of cGAS & STING after overexpression of TREX1 in SK-MEL-1 cell line. (b): Western blot analysis representing expression of cGAS & STING after overexpression of TREX1 in SK-HEP-1 cell line. (c): Western blot analysis representing involvement of TREX1 overexpression in regulating cGAS/STING pathway in SK-MEL-1 cell line. (d): Western blot analysis representing involvement of TREX1 overexpression in regulating pathways involved in apoptosis and cell growth in SK-MEL-1 cell line. (* = p > 0.05)
Figure 4. Carboplatin activates TREX1 and induce apoptosis and decrease proliferation in human melanoma through cGAS/STING pathway
(a): Western blot analysis representing the expression of cGAS & STING after carboplatin stimulation in SK-MEL-1 cell line. (b): Western blot analysis representing the expressionof cGAS & STING after after carboplatin stimulation in SK-HEP-1 cell line. (c): Western blot analysis representing the involvement of carboplatin in regulating the cGAS/STING pathway in the SK-MEL-1 cell line. (d): Western blot analysis representing the involvement of carboplatin in regulating pathways involved in apoptosis and cell growth in the SK-MEL-1 cell line. (e): Flow cytometry analysis representing apoptosis rate after carboplatin stimulation in SK-MEL-1 cell line. (f): MTT analysis representing cell viability rate after carboplatin stimulation in SK-MEL-1 cell line. (g): Flow cytometry analysis representing apoptosis rate after carboplatin stimulation in SK-HEP-1 cell line. (h): MTT analysis representing cell viability rate after carboplatin stimulation in SK-HEP-1 cell line. (* = p > 0.05)
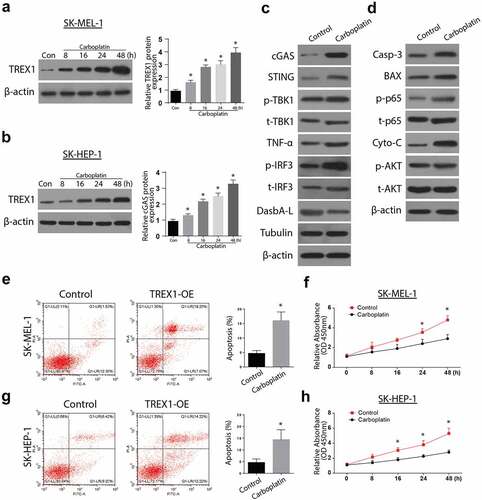
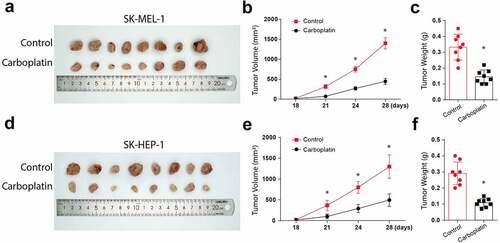
Figure 5. Carboplatin treatment reduces the in-vivo tumor size and volume
(a): Visual observation of tumor size in nude mice inoculated with SK-MEL-1 cell line along with carboplatin treatment. (b): Comparison of tumor volume (mm3) in nude mice inoculated with SK-MEL-1 cell line along with carboplatin treatment. (c): Comparison of tumor weight (g) in nude mice inoculated with SK-MEL-1 cell line along with carboplatin treatment. (d): Visual observation of tumor size in nude mice inoculated with SK-HEP-1 cell line along with carboplatin treatment. (e): Comparison of tumor volume (mm3) in nude mice inoculated with SK-HEP-1 cell line along with carboplatin treatment. (f): Comparison of tumor weight (g) in nude mice inoculated with SK-HEP-1 cell line along with carboplatin treatment. (* = p > 0.05)