Figures & data
Figure 1. SNHG10 is up-regulated in colorectal cancer. (a) Starbase analysis of the expression of SNHG10 in human colorectal cancer and tumor-adjacent normal tissues in the database. (b) The survival rate of patients with high and low expression of SNHG10. (c) RT-qPCR was used to assess the expression of SNHG10 in different human colorectal cancer (HCT116 and DXH-1 cells) and the normal fetal human colon epithelial cell line FHC cells. (d) HCT116 and DXH-1 cells were transfected with si-SNHG10 or NC. The results are representative of three independent experiments. The data are presented as the mean ± SD. n = 3 for each group. **P < 0.01 vs. si-NC group
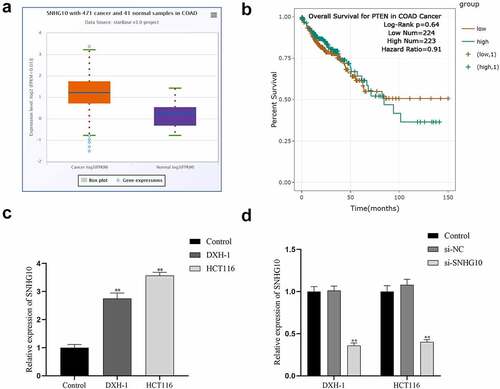
Figure 2. Knockdown of SNHG10 inhibits cell progression of HCT116 and DXH-1 cells. (a) Cell Counting Kit-8 assay was explored to measure cell viability. (b) The BrdU incorporation assay was performed to assess cell proliferation. Magnification ×200. (c) Transwell assay was performed to assess cell migration. The results were representative of three independent experiments. The results were representative of three independent experiments. Magnification ×200. The data are presented as the mean ± SD. n = 3 for each group. **P < 0.01 vs. control group
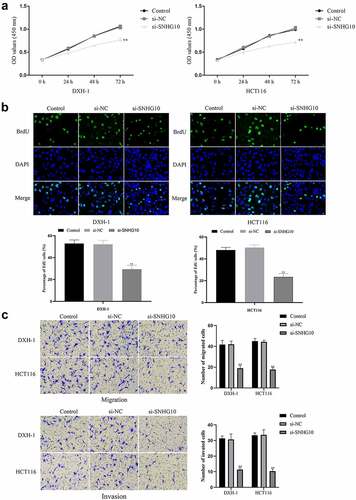
Figure 3. miR-3690 serves as a direct SNHG10 target in HCT116 and DXH-1 cells. (a) The putative binding sites between miR-3690 and SNHG10 were predicted by StarBase. (b) Dual-luciferase reporter assay was performed to reveal the relationship between miR-3690 and SNHG10. (c) Starbase analysis of the expression of miR-3690 in human colorectal cancer and tumor-adjacent normal tissues in the database. (d) RT-qPCR was performed to assess the mRNA expression of miR-3690 in CRC cell lines. The results were representative of three independent experiments. The data are presented as the mean ± SD. **P < 0.01 vs. control group
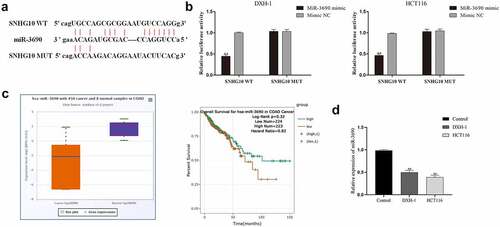
Figure 4. miR-3690 downregulation reverses the effect of SNHG10 downregulation in HCT116 and DXH-1 cells. (a) HCT116 and DXH-1 cells were co-transfected miR-3690 inhibitor along with si-SNHG10, respectively. (b) Cell Counting Kit-8 assay was explored to measure cell viability. (c) the BrdU incorporation assay was performed to assess cell proliferation. Magnification ×200. The data are presented as the mean ± SD. n = 3 for each group. **P < 0.01 vs. control group, &P < 0.05, &&P < 0.05 vs. si- SNHG10 group
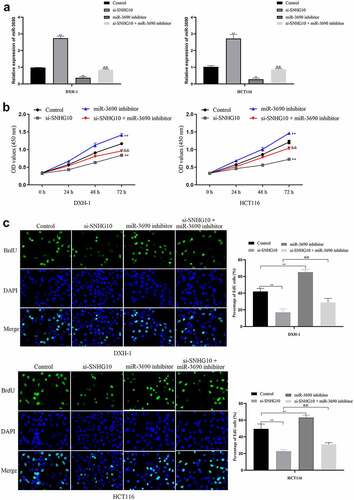
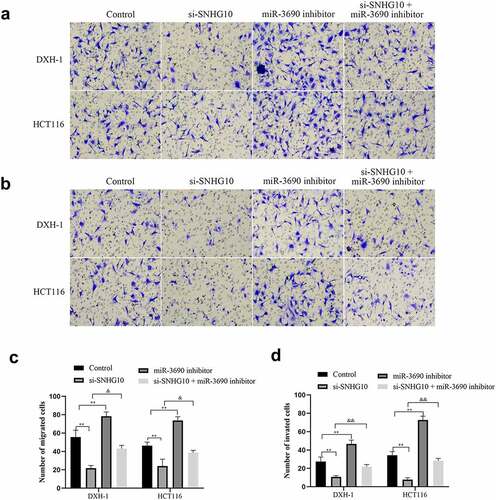
Figure 5. miR-3690 downregulation reverses the effect of SNHG10 in HCT116 and DXH-1 cells. (a, b) Transwell assay was performed to assess cell migration and invasion. The results were representative of three independent experiments. Magnification ×200. The data are presented as the mean ± SD. n = 3 for each group. **P < 0.01 vs. control group, &P < 0.05, &&P < 0.05 vs. si- SNHG10 group