Figures & data
Figure 1. Construction of gene co-expression modules. (a) Analysis of network topology for various soft-thresholding powers. (b) Gene clustering tree (dendrogram) obtained by hierarchical clustering of adjacency-based dissimilarity. (c) Module-feature associations. Each row corresponds to a module eigengene, and each column corresponds to a clinical feature. Red represents a positive correlation, and green represents a negative correlation. The darker the corresponding color, the stronger the correlation coefficient. (d) Scatter plot of eigengene modules
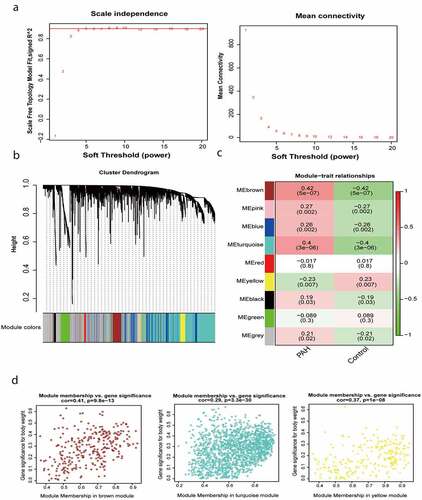
Figure 2. GO functional analysis of the profiles. GO biological processes of genes in brown module (a), turquoise module (b), yellow module (c)
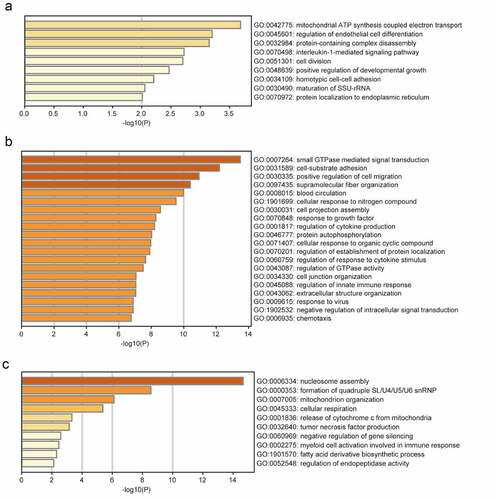
Figure 3. KEGG pathway analysis of the profiles. KEGG enrichment analysis of genes in brown module (a), turquoise module (b), yellow module (c)
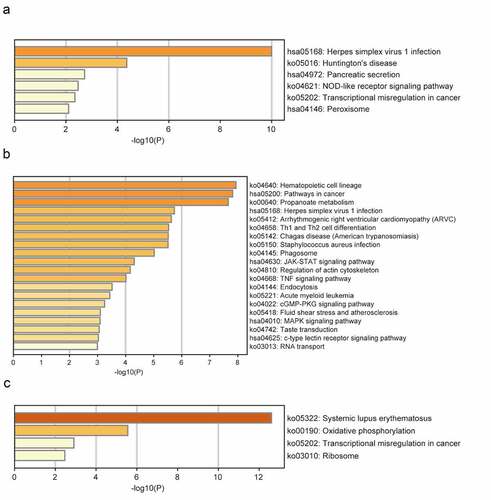
Figure 4. Identification of hub genes. The network of hub genes in the (a) brown module, (b) turquoise module, (c) yellow module. Red represents a positive correlation, The darker the color, the stronger the correlation
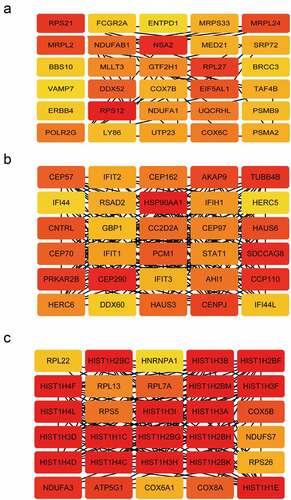
Figure 5. Screening and verification of key genes. (a-b) Least absolute shrinkage and selection operator (LASSO) logistic regression algorithm to screen key genes.(c) Venn diagram. Blue section stands for hub genes, pink section stands for differentially expression genes (DEGs), 59 genes in the middle overlapping section. (d) Receiver operating characteristic (ROC) curves analysis of training set and testing set. AUC, area under the curve
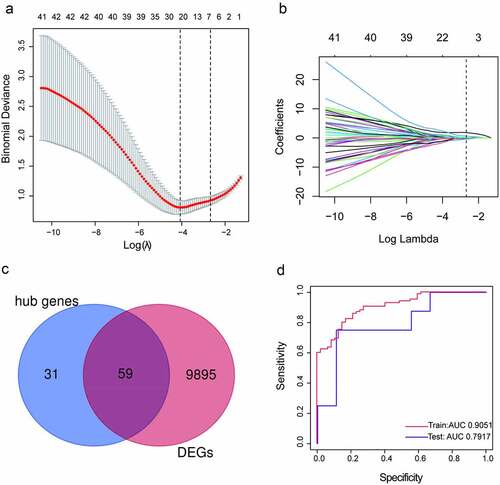
Figure 6. Validation of the key genes in a rat PAH model (a) Mean right ventricular systolic pressure (mRVSP) in control and MCT-induced PAH rats. (b) The levels of HIST1H1C, IFI44L, STAT1, TAF4B, and MLLT3 mRNA expression in lung tissues from control and MCT-induced PAH rats; (c) The expression of IFI44L and STAT1 in the lung tissue of the control group and PAH group. Representative immunostaining images of lung sections show the expression of IFI44L and STAT1 increased in the lung tissues of MCT-induced PAH rats. Scales bars, 50 μm for high-resolution images (original magnificationⅹ400). N = 6 for the control group and PAH group. Compared with the control group, ***P < 0.001. Data presented in A and B are mean ± SEM of three independent experiments. PAH, pulmonary arterial hypertension
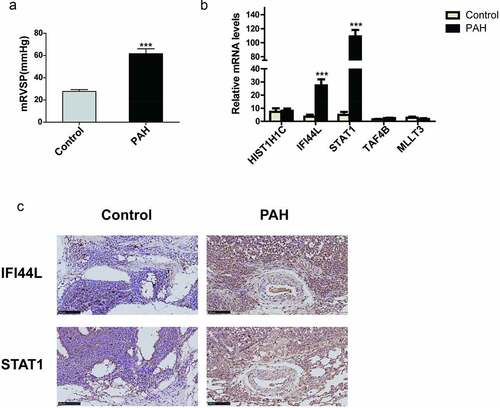
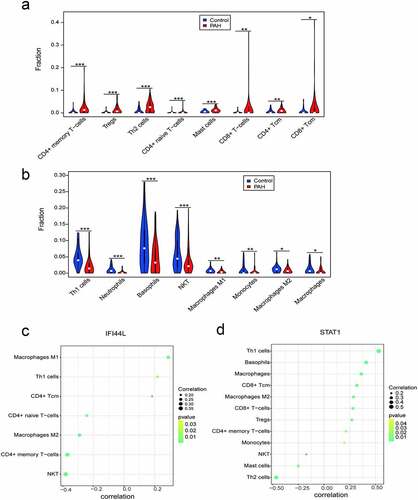
Figure 7. Different immune cell infiltration between PAH and control group. (a) Violin diagram of the proportion of immune cells which infiltrated more in PAH group than in control group; (b) Violin diagram of the proportion of immune cells which infiltrated less in PAH group than in control group. ***P < 0.001, **P < 0.01, *P < 0.05. Correlation between IFI44L, STAT1, and infiltrating immune cells. (c) Correlation between IFI44L and infiltrating immune cells. (d) Correlation between STAT1 and infiltrating immune cells. PAH, pulmonary arterial hypertension