Figures & data
Figure 1. A flow chart based on the content
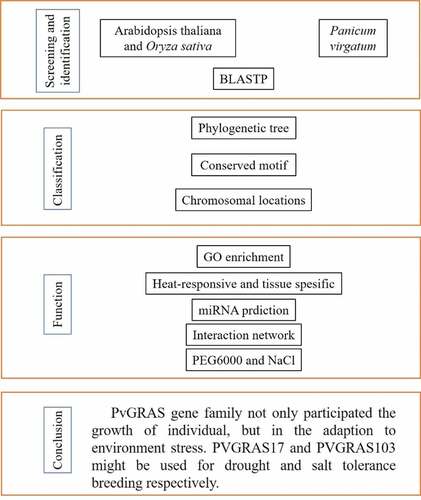
Figure 2. Phylogenetic relationships of GRAS genes. The phylogenetic tree (neighbor joining) was constructed using all of the candidate GRAS proteins in P. virgatum (Pv: 144) and A. thaliana (At: 31) which were classified into 8 subfamilies. The branches sharing the same color are in the same subfamily
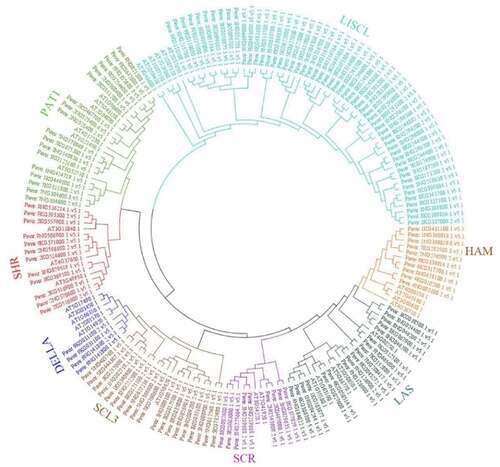
Figure 3. Exon-intron structure of switchgrass GRAS genes. Orange boxes indicate non-coding regions (UTR), green boxes indicate coding sequences (CDS), and black lines indicate introns
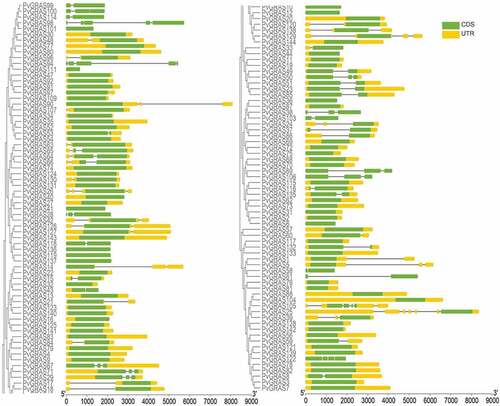
Figure 4. Structure analysis of PvGRAS genes. (a) Phylogenetic tree of GRAS proteins in switchgrass. (b) Distribution of motifs of PvGRAS proteins. (c) The conserved domains in PvGRAS genes. The length of the nucleic acid sequences is indicated by the length of the line, and the positions of the color blocks on the lines are the position of the motifs on the nucleic acid sequence. (d)Fifteen colors represent different motifs and the green color represent GRAS domains and yellow corresponding DELLA domains
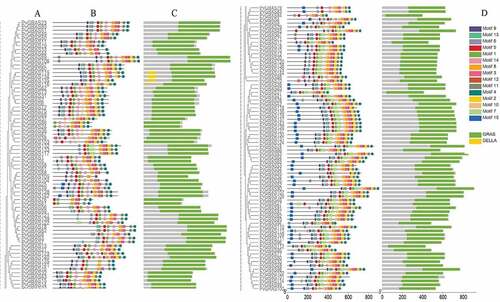
Figure 5. Positions of GRAS gene family members on the switchgrass chromosomes. The leftmost is the chromosome length ruler. The chromosomes were represented by the bars in the figure, and the length represented the size of the chromosomes. The GRAS genes were marked in red at the corresponding position on the chromosome. Genes in tandem repeats are shown beside the blue lines
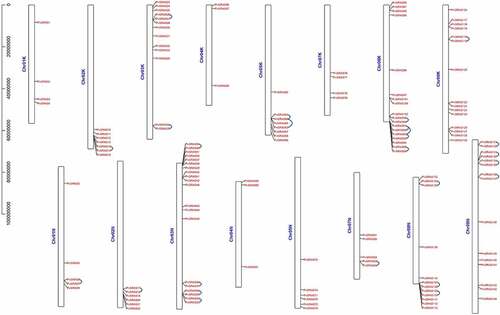
Figure 6. Synteny analysis of PvGRAS genes. Black, red, orange, yellow, green, cyan, blue and purple lines were shot from 1–9 chromosomes (no include 6), respectively. lines indicate all synteny gene pairs in the switchgrass genome
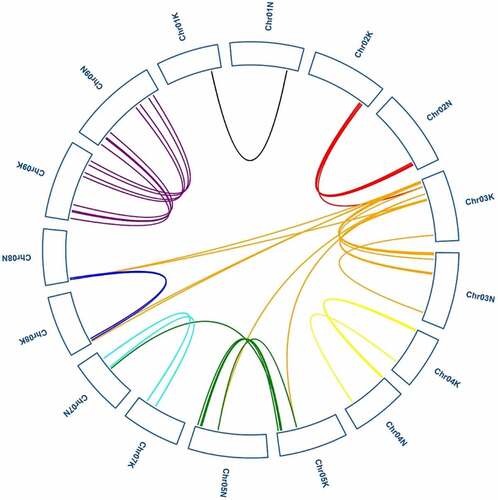
Figure 7. Synteny analysis of the GRAS genes between switch and Oryza sative. Gray lines in the background indicate the collinear blocks within switchgrass and Oryza sative, while blue lines highlight the syntenic PvGRAS gene pairs
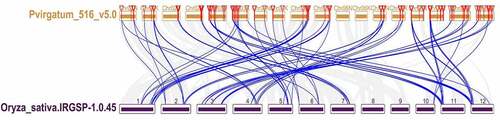
Figure 8. The interaction between miRNA and PvGRAS. Red blocks: PVGRAS, blue: miRNA and yellow: miR171. Lines between the squares indicated that they could interact with each other
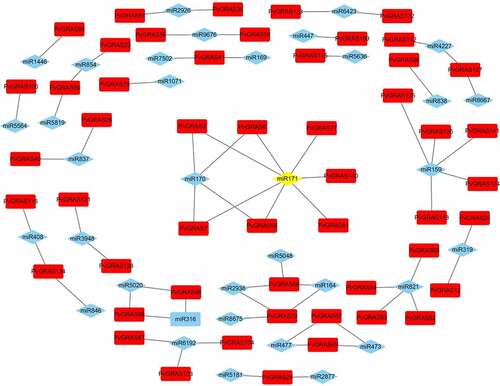
Figure 9. Cis-elements about GARE-motif, TATC-box and P-box in PvGRAS promoters analyzed by plantCARE
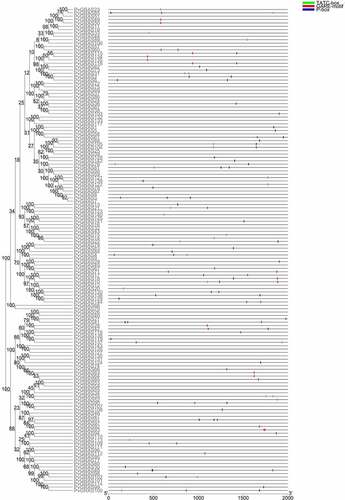
Figure 10. Functional interaction networks of PvGRAS proteins in switchgrass according to orthologs in Arabidopsis. Red: GRAS proteins from Arabidopsis, green: GRAS proteins from switchgrass. The lines between red block represented that they could interaction with each other, the lines between red and green block represented the homologous relationship
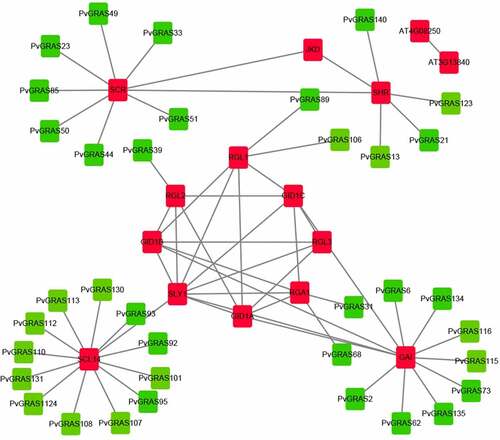
Figure 11. Top 7 GO enrichment analysis results were shown. GO3700: DNA-binding transcription factor activity, GO5634: nucleus, GO5737: cytoplasm, GO6355: regulation of transcription, DNA-templated, GO8356: asymmetric cell division, GO9956: radial pattern formation, GO43565: sequence-specific DNA binding, GO48366: leaf development
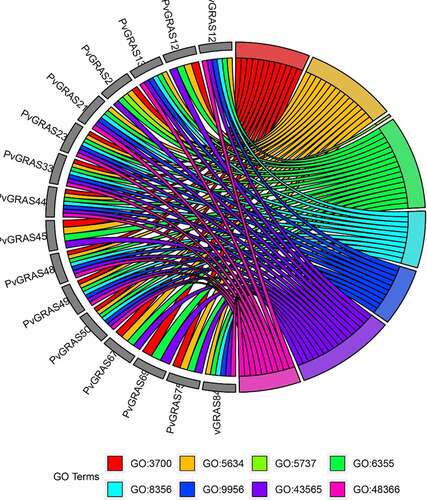
Figure 12. GRAS genes expression pattern analysis. a. genes expression in different temperature. b. The PVGRAS genes special expression profiles in different tissues. c. Time-dependent cluster analysis. a Clustering according to changes in expression levels at different time (24, 48, 72, 96 h) points during seed germination. b Clustering according to changes in different development stages (meristem initiation, floret development, Rachis and brach elongation, Panicle emergence) during inflorescence development
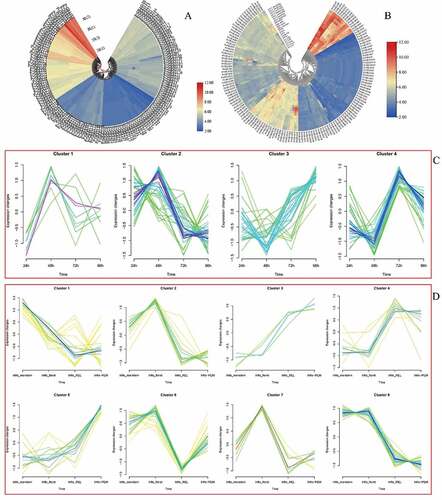
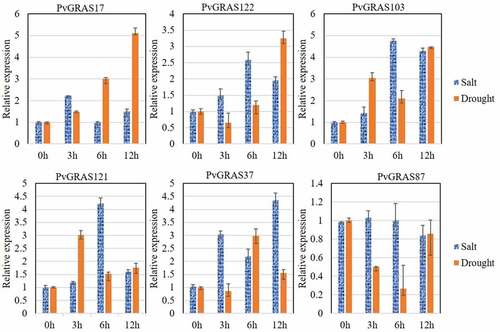
Figure 13. The PVGRAS genes special expression under drought and salt