Figures & data
Figure 1. Pino decreased the cell viability of A549 cells. Cell viability was detected using CCK-8 assay at (a) 24 h, (b) 48 h and (c) 72 h. **P < 0.01, ***P < 0.001 versus Pino 0 µM
Figure 2. Pino decreased the proliferation of A549 cells. (a) The colony formation of A549 cells upon exposure to various concentrations of pino. (b) The expression of proliferation-related proteins in A549 cells after pino exposure. *P < 0.05, ***P < 0.001 versus Pino 0 µM
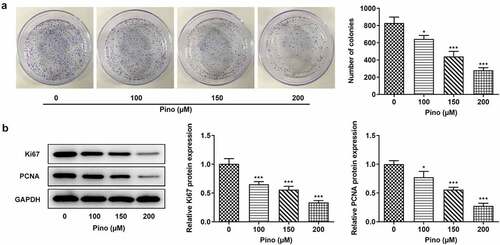
Figure 3. Pino promoted the apoptosis of A549 cells. (a, b) The apoptosis of A549 cells upon exposure to various concentrations of pino. (c) The activity of caspase3 detected by corresponding commercial kits in A549 cells exposed to pino. (d) The apoptosis-related protein levels were examined after A549 cells treated with pino. *P < 0.05, **P < 0.01, ***P < 0.001 versus Pino 0 µM
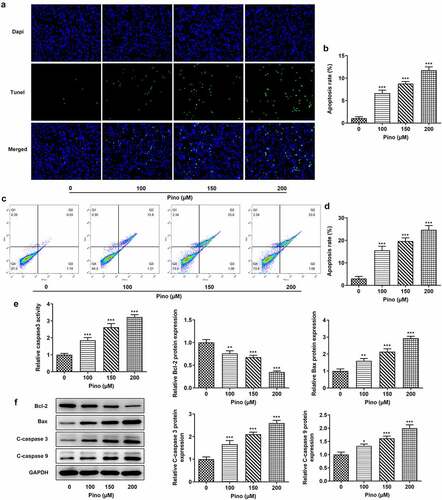
Figure 4. Pino reduced the autophagy of A549 cells. (a) The autophagy protein levels in A549 cells treated with pino were examined by western blot . (b) The autophagy level in pino-treated A549 cells was measured by immunofluorescence staining. **P < 0.01, ***P < 0.001 versus Pino 0 µM
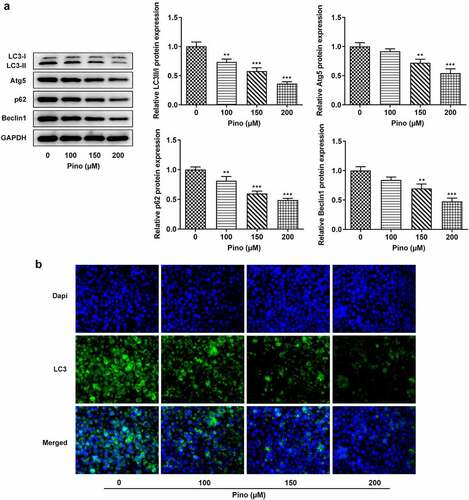
Figure 5. RAPA reversed the suppression of pino on the autophagy and proliferation of A549 cells. (a-b) The expression of autophagy proteins, (c) cell viability, (d, e) colony formation, and (f) expression of proliferation-related proteins were examined in A549 cells co-treated with pino and RAPA. ***P < 0.001 versus Control, #P < 0.05, ##P < 0.01 versus Pino-200
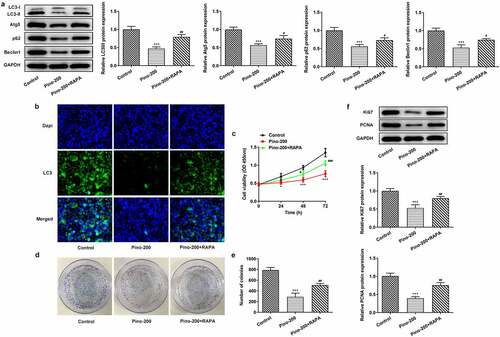
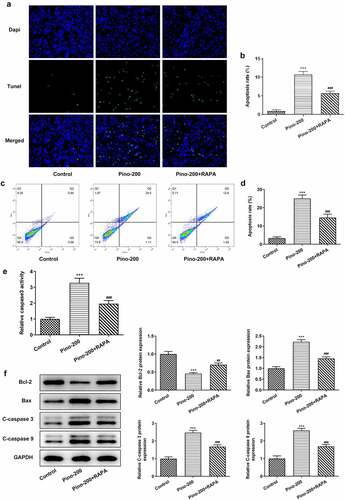
Figure 6. RAPA reversed the promotive effects of pino on the apoptosis of A549 cells. (a) The apoptosis, (b) caspase3 activity and (c) apoptosis-related proteins in A549 cells exposed to pino and RAPA. ***P < 0.001 versus Control, ##P < 0.01, ###P < 0.001 versus Pino-200