
Figures & data
Figure 1. Analysis of differentially expressed exosomal RNAs between patients with gall bladder cancer and those with xantho-granulomatous cholecystitis. A-C. Identification of exosomes isolated from human plasma by transmission electron microscope, nanoparticle tracking analysis, and flow cytometry. D. Bar graph showing the gene distributions of human chromosomes. E-G. Heat maps and volcano plots of DE mRNAs, lncRNAs, and circRNAs
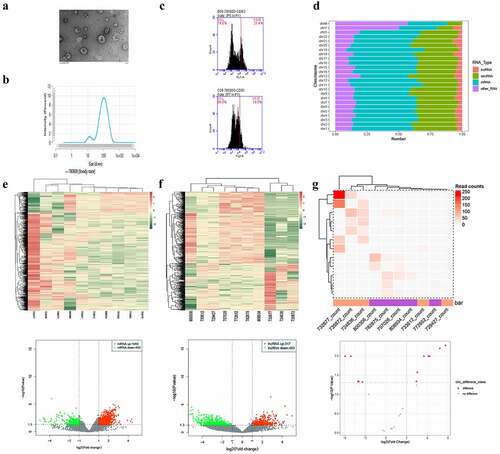
Figure 2. Enrichment analysis of differentially expressed (DE) mRNAs and circRNAs between gall bladder cancer and xantho-granulomatous cholecystitis. A, B. Gene Ontology (GO) analysis of DE mRNAs (upregulation and downregulation). C. GO analysis of DE lncRNAs. D. GO analysis of target miRNAs of DE circRNAs. E, F. KEGG analysis of DE mRNAs (upregulation and downregulation). G. KEGG analysis of DE lncRNAs. H. KEGG analysis of target miRNAs of DE circRNAs
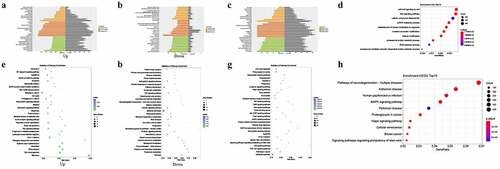
Figure 3. Enrichment analysis of differentially expressed lncRNA-targeted genes. a. Gene Ontology (GO) analysis. b. Kyoto Encyclopedia of Gene and Genome (KEGG) analysis
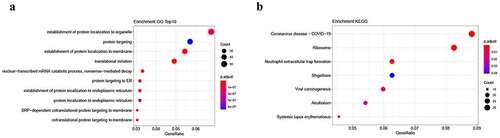
Figure 4. LncRNA-mRNA interaction network for plasma-derived exosomes of patients with gall bladder cancer
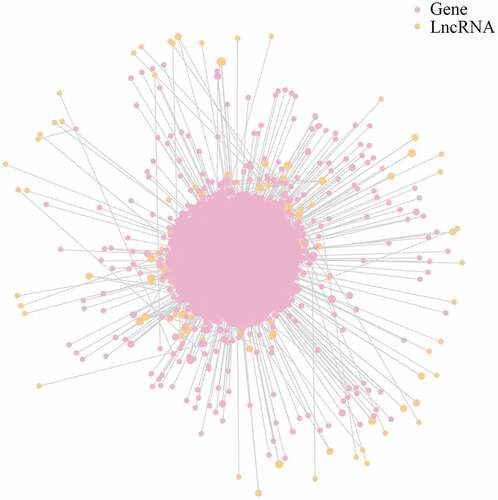
Figure 5. CeRNA network of circRNAs and miRNAs for plasma-derived exosomes of patients with gall bladder cancer
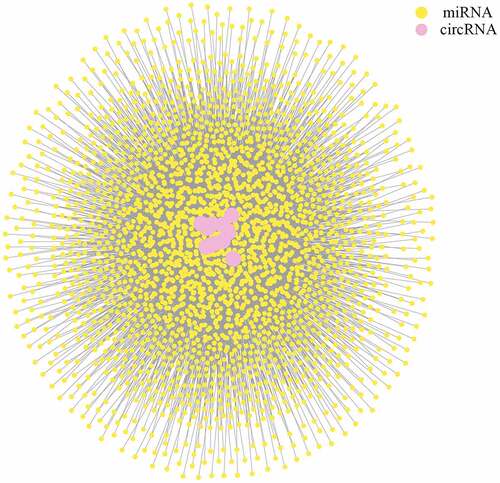
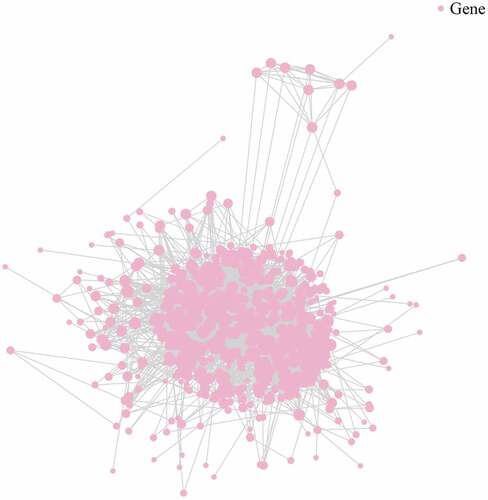
Figure 6. Illustration of protein-protein network for plasma-derived exosomes of patients with gall bladder cancer
Supplemental Material
Download ()Data availability statement
Data and analyses can be obtained from the corresponding author on a reasonable request. Sequence data are available from the GEO (GSE166915).