Figures & data
Figure 1. Enzyme catalysis reaction in ALT kit
Figure 2. Expression of ldLDH in E. coli and purification analysis
a) Schematic description of pET-28a-ldLDH expression plasmid. b) Expression of ldLDH at different temperatures and induction concentrations: the temperature was set at 16°C, 25°C, and 30°C; IPTG was used for expression induction at three different concentrations, 0.1 mM, 0.5 mM, and 1.0 mM. A strain cultured at 25°C without IPTG was used as control. After overnight incubation, the supernatant was used for SDS-PAGE analysis. c) Purification of ldLDH with a C-terminal His6-tag by nickel affinity chromatography. D) SDS-PAGE analysis of purified ldLDH. lane 1, crude extract; lane 2, supernatant; lane 3, flow through; lane 4–5, purified ldLDH.
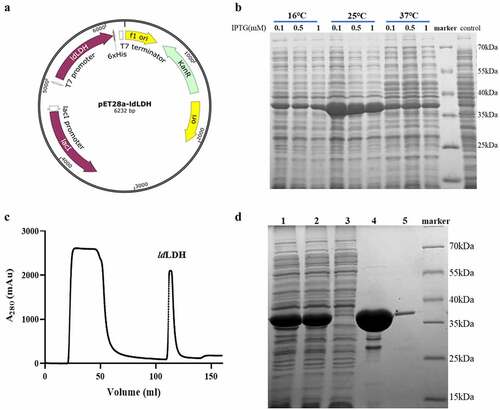
Figure 3. pH and temperature dependence of ldLDH activity
a) Effect of pH on the activity of ldLDH. Citrate buffer (pH 5.0–6.0), phosphate buffer (pH 6.0–7.5), Tris buffer (pH 7.5–9.0), carbonate buffer (pH 10.0–11.0). b) Effect of temperature on ldLDH activity. The activity of ldLDH was determined at the indicated temperatures. Data are expressed as a percentage of enzyme activity as assayed at 55°C. Error bars in the Figure indicate standard deviation from three parallel replicates.
Table 1. Effects of additives on ldLDH activity
Table 2. Comparison of biochemical properties of D-LDH from various strains
Table 3. LdLDH stabilizer screening
Figure 4. Lineweaver-Burk plot of ldLDH
Figure 5. Effects of pH and temperature on ldLDH stability
a) Stability of ldLDH was determined by incubating for 30 min at the indicated pH value and then assayed at pH 8.0. Data are expressed as a percentage of maximal enzyme activity. b) Effect of temperature on the stability of ldLDH. Error bars in the figure indicate standard deviation of three parallel replicates.
Figure 6. Performance of ldLDH in ALT kit
Serum ALT activity from 3–1,400 U/L (a) and 3 − 150 U/L (b) was measured using the ALT kit with pure ldLDH (ALT-ldLDH) and commercial ALT kit (ALT-MR). C) The relative deviation between ALT-ldLDH and ALT-MR was determined using a commercial kit (ALT-MR) as a standard control.