Figures & data
Figure 1. LINC01207 is overexpressed in OSCC tissues and cells. (a) RT-qPCR was conducted to detect the expression of LINC00520, LINC00461, LINC00460, LINC00052, LINC00467, and LINC01207 in OSCC tissues and adjacent normal tissues. (b) LINC01207 expression in NOK, HSC-3, and HSC-4 cells was measured using RT-qPCR. ***P < 0.001.
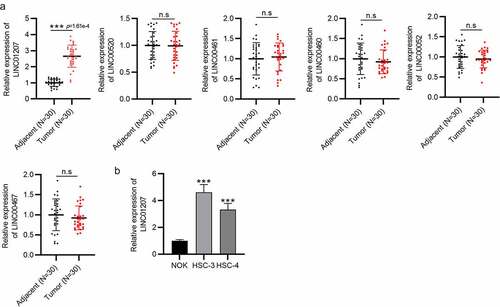
Figure 2. Effects of LINC01207 silencing on OSCC cells. (a) RT-qPCR was used to detect the LINC01207 level in HSC-3 and HSC-4 cells after transfecting sh-LINC01207#1/2. (b) CCK-8 assay was employed to assess cell viability in the transfected cells. (c) the number of colonies after transfection was detected using colony formation assay. (d) transwell assay was used to examine the impact of LINC01207 knockdown in OSCC cell migration. (e) cell apoptosis after transfection was evaluated by flow cytometry. (f) western blot was conducted for the detection of the expression of autophagy-related protein (ATG5, P62, LC3-I/II). *P < 0.05, **P < 0.01, ***P < 0.001.
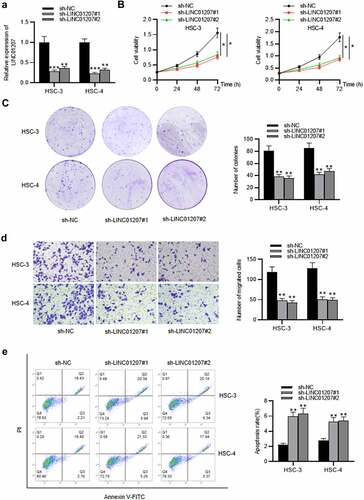
Figure 2. Continued.
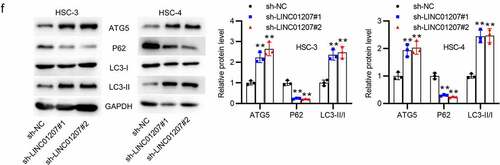
Figure 3. Effects of LINC01207 overexpression on OSCC cells. (a) RT-qPCR was used to detect the LINC01207 level in HSC-3 and HSC-4 cells after transfecting pcDNA3.1-LINC01207. (b) cell viability was detected by CCK-8 assay. (c) the number of colonies was detected using colony formation assay. (d) transwell assay was used to examine the impact of LINC01207 overexpression in cell migration. (e) cell apoptosis was evaluated by flow cytometry. (f) western blot was conducted to measure the expression of autophagy-related protein (ATG5, P62, LC3-I/II). *P < 0.05, **P < 0.01.
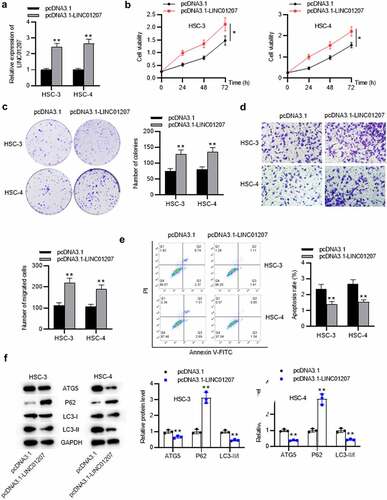
Figure 4. LINC01207 sponges miR-1301-3p. (a) FISH assay was performed to reveal the subcellular location of LINC01207. (b) RT-qPCR was performed to detect the miRNA level in HSC-3, HSC-4, and NOK cells. (c) the miR-1301-3p level in OSCC cells after transfecting pcDNA3.1-LINC01207 was measured using RT-qPCR. (d) the binding site between LINC01207 and miR-1301-3p. (e) after pcDNA3.1 transfection, the luciferase activity of pmirGLO-miR-1301-3p-Wt and pmirGLO-miR-1301-3p-Mut in OSCC cells was detected by a luciferase reporter assay. (f) correlation analysis of the expression of LINC01207 and miR-1301-3p in OSCC tissues. **P < 0.01.
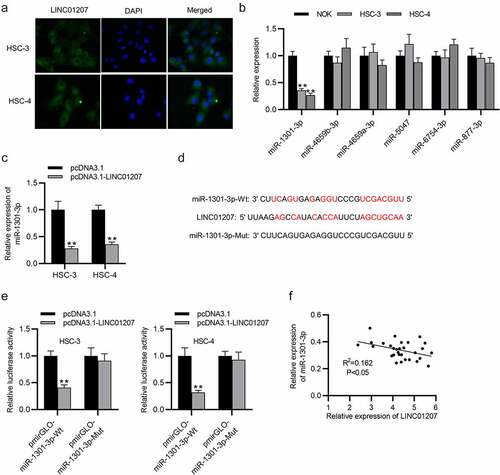
Figure 5. LDHA is targeted by miR-1301-3p. (a) the mRNA expression in OSCC cells was revealed by RT-qPCR. (b) the expression of miR-1301-3p in OSCC cells after transfection with NC mimics and miR-1301-3p mimics was assessed by RT-qPCR. (c) the binding site between miR-1301-3p and LDHA 3ʹUTR. (d) A luciferase reporter assay was conducted to evaluate the luciferase activity of pmirGLO-LDHA 3ʹUTR-Wt and pmirGLO-LDHA 3ʹUTR-Mut in OSCC cells after overexpression of miR-1301-3p. (e) the LDHA protein expression in OSCC cells after miR-1301-3p overexpression or LINC01207 downregulation was measured by western blot. (f) Ago-2 RIP assay was conducted to detect the enrichment of LINC01207, miR-1301-3p and LDHA in RNA-induced silencing complexes. **P < 0.01, ***P < 0.001.
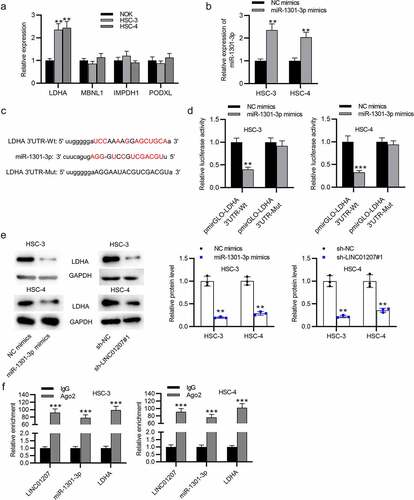
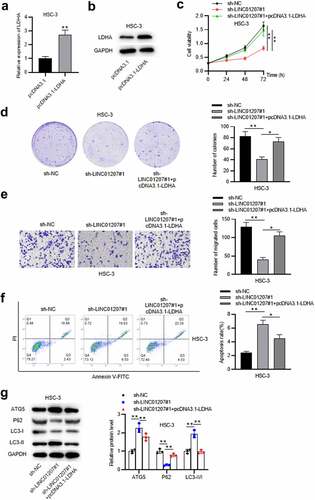
Figure 6. LDHA overexpression reverses the effects of LINC01207 knockdown in OSCC. (a and b) RT-qPCR and western blot analysis of the expression of LDHA in HSC-3 cells after transfecting pcDNA3.1-LDHA. (c-g) after transfecting sh-LINC01207#1 or co-transfecting sh-LINC01207#1 with pcDNA3.1-LDHA in HSC-3 cells, the cell viability was assessed by CCK-8 assay, proliferation was evaluated by colony formation assay, migration was examined by transwell assay, apoptosis was detected by flow cytometry assay, and the protein levels of autophagy-related proteins were presented by western blot. *P < 0.05, **P < 0.01.