
Figures & data
Figure 1. Highly expressed RECQL4 in HCC tissues and cell lines was related to the poor prognosis. (a) GEPIA2 database was employed to analyze RECQL4 expression in HCC tissues (t) and normal liver tissue (n). (b-c) RECQL4 expression in several HCC (Hep10, HuH-7, SNU-387 and Li-7) cell lines and one human immortalized liver cell line MIHA was examined with western blot analysis and RT-qPCR. (d) the relationship between RECQL4 and survival probability was evaluated using UALCAN database. *P < 0.05, ***P < 0.001
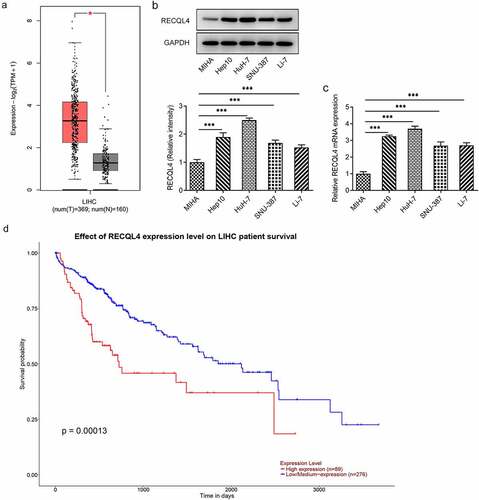
Figure 2. RECQL4 deletion inhibited the proliferation, migration and invasion of HCC cells. (a-b) RT-qPCR and western blot analysis were utilized for detection of RECQL4 expression after transfection with si-RECQL4#1 or si-RECQL4#2 in HuH-7 cells. ***P < 0.001. (c) cell viability was assessed with CCK-8 assay. *P < 0.05, ***P < 0.001 vs. si-NC. (d) the capacity of cell migration was tested by wound healing assay. (e) transwell assay was adopted for determining cell invasion. (f) the expression of E-cadherin, N-cadherin and vimentin was tested with western blotting. ***P < 0.001
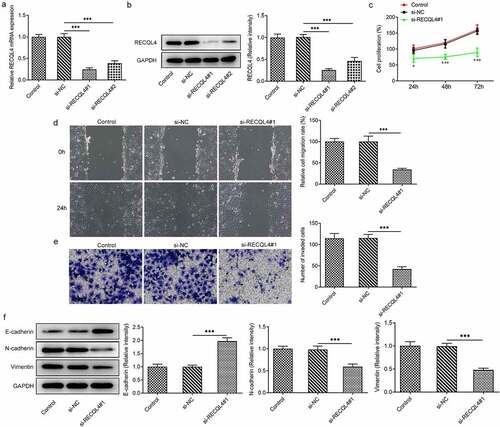
Figure 3. SRSF1 was a RNA binding protein of RECQL4 and could regulate RECQL4 expression. (a) the correlation between RECQL4 and SRSF1 was analyzed by ENCORI database. (b) the binding of SRSF1 to RECQL4 mRNA was predicted with ENCORI database. (c) the combination probability of SRSF1 to RECQL4 mRNA was analyzed using database. (d) the binding sites of SRSF1 to RECQL4 mRNA were analyzed by means of predictor. (e) RIP assay was performed to verify the combination between SRSF1 and RECQL4. (f-g) SRSF1 mRNA and protein levels after transfection with si-SRSF1 were determined with RT-qPCR and western blotting. (h-i) SRSF1 mRNA and protein levels after HuH-7 cells exposed to actinomycin D were determined with RT-qPCR and western blotting. **P < 0.01, ***P < 0.001 vs. si-NC
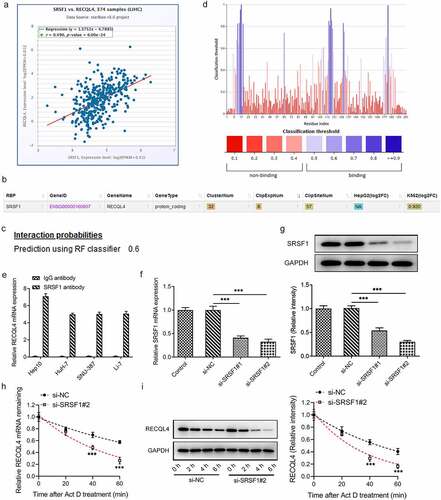
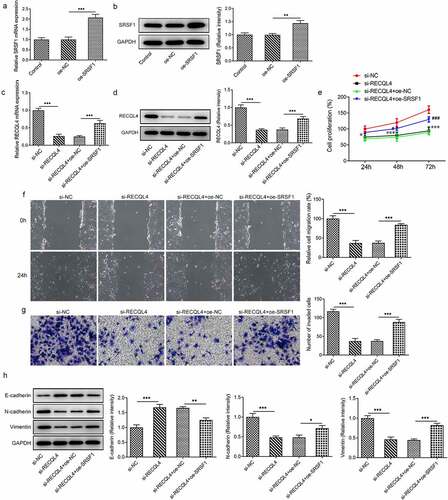
Figure 4. SRSF1 overexpression crippled the repressive impact of RECQL4 silencing on the proliferation, migration and invasion of HCC cells. (a-b) RECQL4 levels were assessed using RT-qPCR and western blot assay after transfection with RECQL4 plasmid. (c-d) RT-qPCR and western blotting were conducted to assess RECQL4 expression after transfection with si-RECQL4 and Oe-SRSF1. **P < 0.01, ***P < 0.001. (e) cell viability was tested with CCK-8 kit. *P < 0.05, ***P < 0.001 vs. si-NC; #P < 0.05, ###P < 0.001 vs. si-RECQL4+ oe-NC. (f) the capacity of cell migration was tested by wound healing assay. (g) transwell assay was adopted for measuring cell invasion. (h) the expression of E-cadherin, N-cadherin and vimentin was tested with western blotting. *P < 0.05. **P < 0.01, ***P < 0.001
Availability of data and materials
All data generated or analyzed during this study are included in this published article.