
Figures & data
Table 1. Abbreviations and full names of all TCGA cancers
Table 2. Clinical information and relative immunohistochemistry results
Figure 1. ACTB expression condition in normal and tumor tissues. (a) ACTB mRNA expression condition in normal tissues based on human protein atlas (HPA) database. (b) ACTB protein expression condition in normal and cancer tissues from the genecards database. (c) ACTB expression in normal colon and lung tissues from HPA database. (d) ACTB expression in colorectal and lung cancer tissues from HPA database
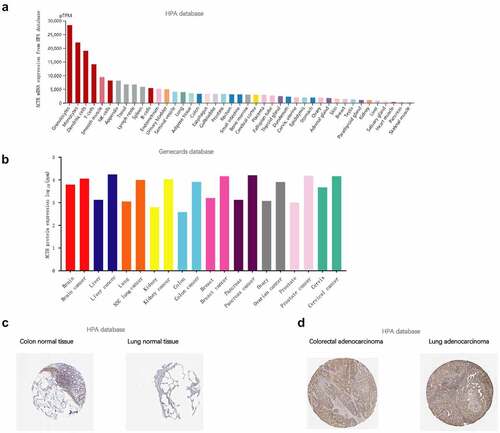
Figure 2. ACTB expression in pan-cancer and different pathological stages. (a) ACTB expression in various cancers in comparison with normal tissues using Oncomine. (b)The expression status of the ACTB in multiple cancers using tumor immune estimation resource 2 (TIMER2). * P < 0.05; ** P < 0.01; *** P < 0.001. (c) ACTB expression in different pathological stages (stage I~ IV) of kidney Chromophobe (KICH), kidney renal clear cell carcinoma (KIRC), stomach adenocarcinoma (STAD), testicular germ cell tumors (TGCT), thyroid carcinoma (THCA), adrenocortical carcinoma (ACC) and bladder Urothelial Carcinoma (BLCA) using GEPIA2 based on the the cancer genome atlas (TCGA) data
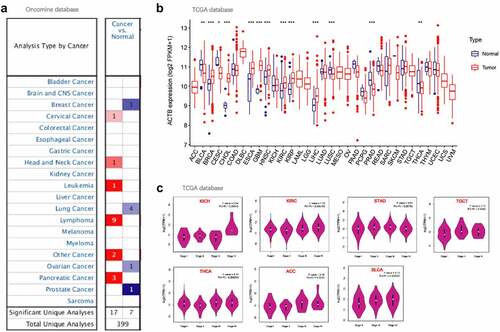
Figure 3. Relationship between ACTB expression and patient prognosis of different cancers based on the TCGA data. (a) OS map and Kaplan-Meier curves of TCGA cancers by ACTB gene expression using gene expression profiling interactive analysis 2 (GEPIA2). (b) DFS map and Kaplan-Meier curves of TCGA cancers by ACTB gene expression using GEPIA2
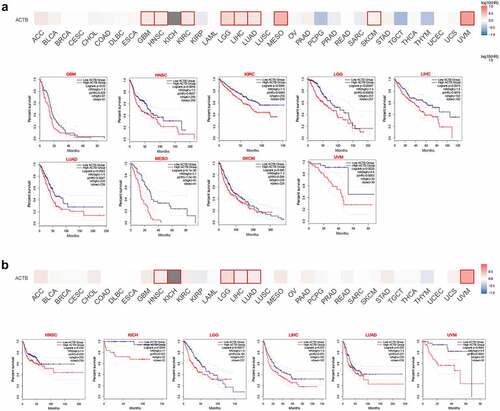
Figure 4. Mutation feature of ACTB in pan-cancer from TCGA. (a)The alteration frequency of ACTB in pan-cancer datasets from TCGA through the cBioPortal database. (b) Mutation count of ACTB across all TCGA cancers using cBioPortal. (c) Mutation site of ACTB in pan-cancer from cBioPortal
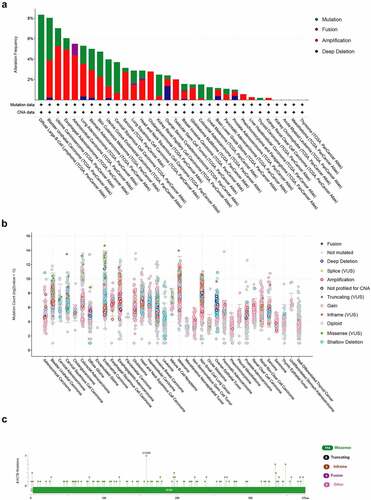
Figure 5. Correlation analysis of ACTB and immune infiltration across all TCGA cancers using TIMER2. (a)The correlations of ACTB expression and immune infiltration across all TCGA cancers by different algorithms through TIMER2. (b) The correlation of ACTB expression and immune infiltration in Thymoma (THYM) on TIMER2
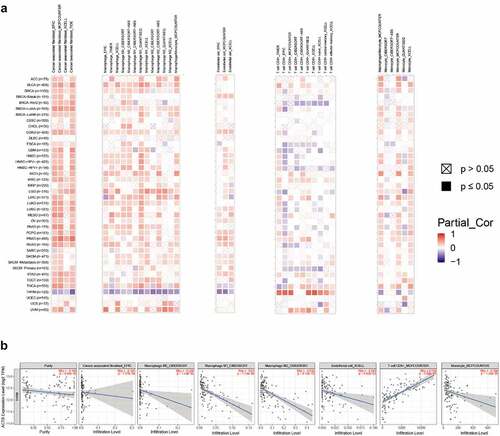
Figure 6. Correlation analysis of ACTB and immune checkpoints, as well as other signatures across all TCGA cancers. (a) The correlation of ACTB and known immune checkpoints across all TCGA cancers. (b) The correlation of ACTB and typical MMR signatures across all TCGA cancers. (c) The correlation of ACTB expression and immune stimulators in cancers through tumor-immune system interaction database (TISIDB). (d) The correlation of ACTB expression and immune inhibitors in cancers through TISIDB. (e) The correlation of ACTB expression and MHC molecules in cancers through TISIDB
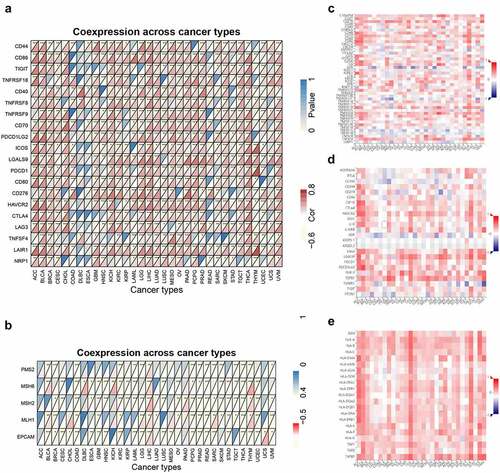
Figure 7. The functional relevance of ACTB across different cancers from cancerSEA website. (a) Average correlations between ACTB and functional states in different cancers from cancerSEA. (b) Functional relevance of ACTB in HNSCC from cancerSEA. Red plots suggested a positive correlation while blue plots suggested a negative correlation
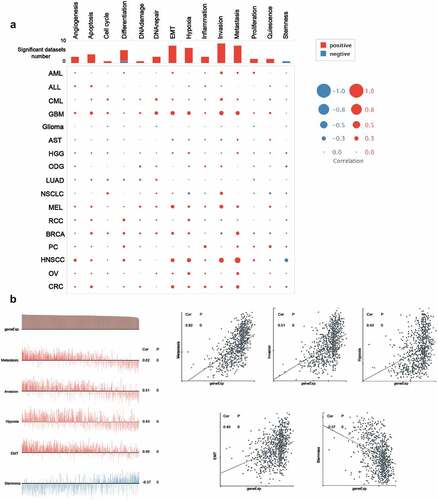
Figure 8. ACTB-related gene enrichment analysis. (a) ACTB-interacted proteins from STRING. (b) Heatmap of the expression correlation between ACTB and ACTN1, PDLIM7, PFN1, SH3BGEL3, ZYX in cancers utilizing TIMER2. (c) The expression correlation between ACTB and ACTN1, PDLIM7, PFN1, SH3BGEL3, ZYX utilizing GEPIA2. (d) Venn diagram of the ACTB-interacted and correlated genes. (e) KEGG pathway analysis based on the ACTB-interacted and correlated genes. (f) The cnetplot of the biological process from GO analysis
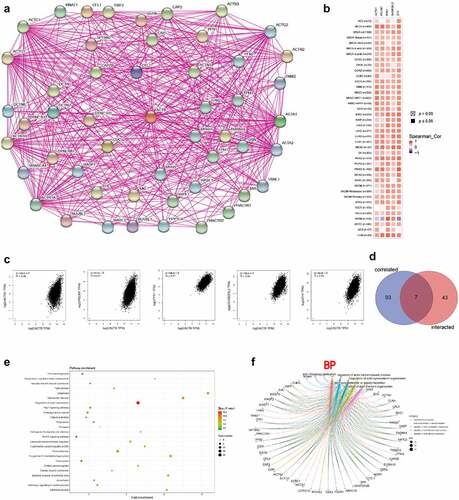
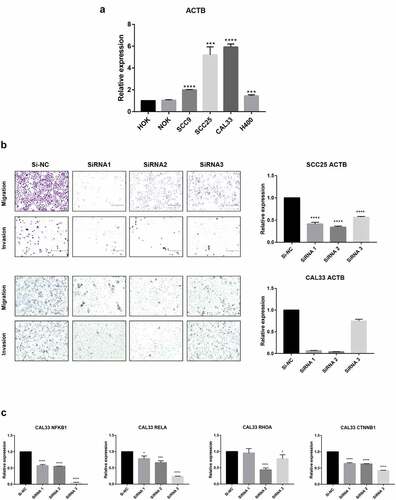
Figure 9. Validation of ACTB mRNA expression and function in HNSC. Normal head and neck cell lines include HOK and NOK and HNSC cell lines include SCC9, SCC25, CAL33 and H400. * P < 0.05; ** P < 0.01; ***P < 0.001; ****P < 0.0001. (a) Comparison of ACTB mRNA expression between normal head and neck and HNSC cell lines. (b) Knockdown of ACTB restrained cell migration and invasion in SCC25 and CAL33 cells. (c) Knockdown of ACTB decreased the expression of NFKB1, RELA, RHOA and CTNNB1
Supplemental Material
Download ()Availability of data and material
All data in our study are available upon reasonable request.