Figures & data
Figure 1. The effects of KCNMB2-AS1 knockdown on ESCA cell growth, motion, and stemness.
(a) KCNMB2-AS1 expression pattern in ESCA tissues (n = 182) compared with normal tissues (n = 286) was detected from TCGA. (b) The KCNMB2-AS1 expression in ESCA cells (Eca109 and TE-1) and normal esophageal epithelial HEsEpiC cells was assesses by RT-qPCR. (c) ESCA cells were transfected with sh-KCNMB2-AS1#1/2 or sh-NC, and the interfering efficiency was confirmed by RT-qPCR. (D-E) ESCA cell proliferation after knockdown of KCNMB2-AS1 was measured by CCK-8 assay and colony formation assay. (f–h) ESCA cell migration and invasion after KCNMB2-AS1 downregulation were examined by wound healing assays and Transwell assays. (i) The number of spheroids in ESCA cells transfected with sh-KCNMB2-AS1#1/2 or sh-NC were detected by sphere formation assay. (j) The protein levels of cancer stem cell markers (CD133, Nanog, Oct 4, Sox 2, and ALDH1) in ESCA cells after downregulating KCNMB2-AS1 was evaluated by Western blotting. *p < 0.05, **p < 0.01, ***p < 0.001.
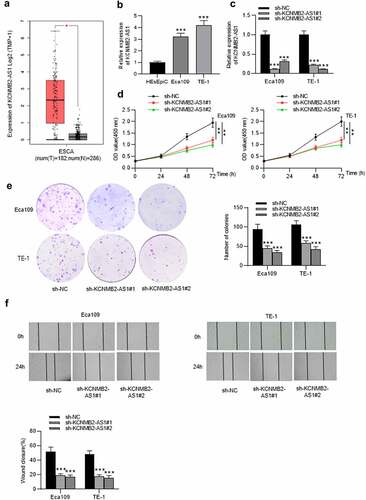
Figure 1. Continued.
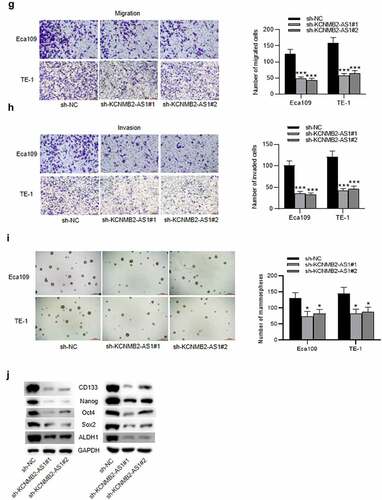
Figure 2. The effects of KCNMB2-AS1 overexpression on ESCA cell growth, motion, and stemness.
(a) ESCA cells were transfected with pcDNA3.1/KCNMB2-AS1 or pcDNA3.1, and the overexpression efficiency was detected by RT-qPCR. (b-c) The proliferation of ESCA cells after overexpressing KCNMB2-AS1 was assessed by CCK-8 assay and colony formation assay. (d-f) ESCA cell migration and invasion after KCNMB2-AS1 overexpression were examined by wound healing assays and Transwell assays. (g) The number of spheroids in ESCA cells transfected with pcDNA3.1/KCNMB2-AS1 or pcDNA3.1 were detected by sphere formation assay. (h) The protein levels of cancer stem cell markers (CD133, Nanog, Oct 4, Sox 2, and ALDH1) in ESCA cells after overexpressing KCNMB2-AS1 was evaluated by Western blotting. *p < 0.05, **p < 0.01, ***p < 0.001.
Figure 2. Contined.
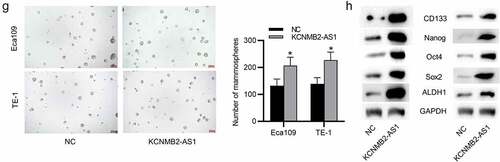
Figure 3. KCNMB2-AS1 binds with miR-3194-3p.
(a) The localization of KCNMB2-AS1 in ESCA cells was determined by a subcellular fractionation assay. (b) Possible miRNAs that bind with KCNMB2-AS1 were identified by starBase website. The level of the candidate miRNAs in ESCA cells compared to normal cells were detected using RT-qPCR. (c) The influence of KCNMB2-AS1 knockdown on the expression of miR-3194-3p in ESCA cells was assessed by RT-qPCR. (d) The potential binding site of KCNMB2-AS1 on miR-3194-3p is shown at starBase website. (e) The RNA pulldown assay was applied to explore whether KCNMB2-AS1 can bind with miR-3194-3p. (f) A luciferase reporter assay was conducted to further verify the relationship between KCNMB2-AS1 and miR-3194-3p. *p < 0.05, **p < 0.01, ***p < 0.001.
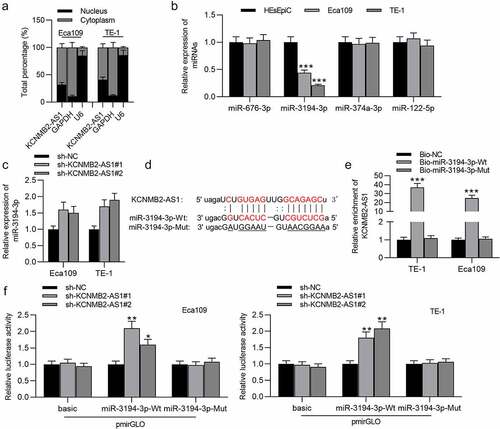
Figure 4. PYGL is targeted by miR-3194-3p.
(a) The overexpression efficiency of miR-3194-3p in ESCA cells was detected using RT-qPCR. (b) Ten mRNAs were identified to be targets of miR-3194-3p using the starBase database. RT-qPCR was performed to examine the expression of these ten mRNAs in ESCA cells transfected with miR-3194-3p mimics or NC mimics. (c) PYGL expression in ESCA tissues (n = 162) relative to normal tissues (n = 11) was predicted at starBase website. (d) RT-qPCR was used to assess the expression of PYGL in ESCA cells and normal esophageal epithelial cells. (e) RT-qPCR was conducted to evaluate how KCNMB2-AS1 knockdown influenced PYGL expression in ESCA cells. (f) PYGL protein levels in ESCA cells transfected with NC mimics, miR-3194-3p mimics, sh-NC, and sh-KCNMB2-AS1 #1/2 were assessed by Western blotting. (g) The possible binding site of PYGL on miR-3194-3p is shown at starBase website. (h) An RNA pulldown assay was carried out to validate the relationship between PYGL and miR-3194-3p. **p < 0.01, ***p < 0.001.
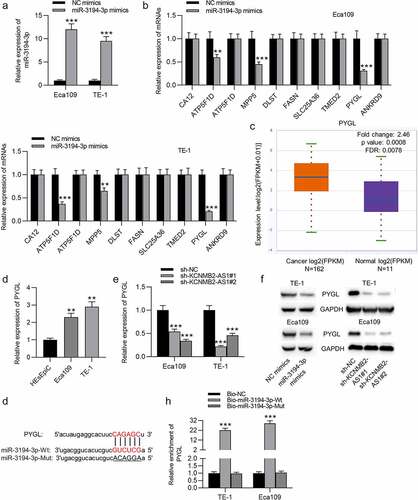
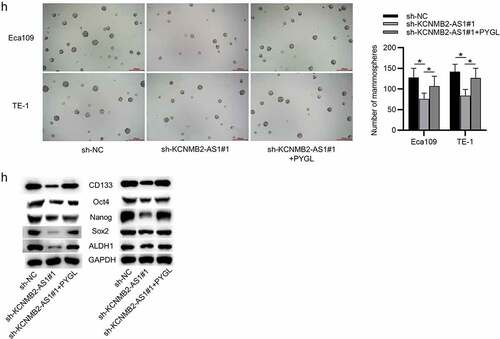
Figure 5. Overexpression of PYGL reverses inhibitory effects of KCNMB2-AS1 knockdown on ESCA cell behavior.
(a–b) RT-qPCR and western blotting were performed to detect the overexpression efficiency of KCNMB2-AS1 in ESCA cells. (c–d) CCK-8 assay and colony formation assay were conducted to detect ESCA cell proliferation in 3 groups: sh-NC group, sh-KCNMB2-AS1 group, sh-KCNMB2-AS1+ PYGL group. (e) Wound healing assay was performed to assess cell migration in the above groups. (f–g) Transwell assays were carried out to measure cell migration and invasion in the above groups. (h) Sphere formation assay was applied to assess the sphere-formation ability of ESCA cells in the above groups. (i) Western blotting was used to evaluate the protein levels of cancer stem cell markers (CD133, Nanog, Oct 4, Sox 2, and ALDH1) in ESCA cells in the above groups. *p < 0.05, **p < 0.01, ***p < 0.001.
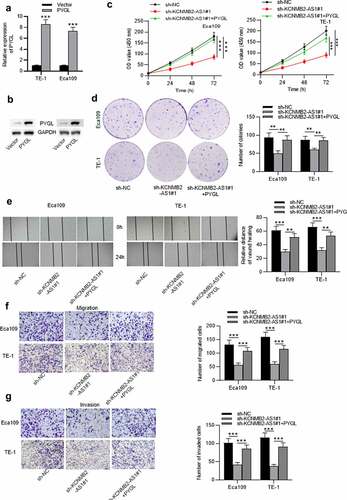
Figure 5. Continued.