
Figures & data
Figure 1. LUM expression was notably decreased in TNF-α-induced hNPCs and LUM deletion reduced TNF-α-induced inflammatory response in hNPCs. (a) Detection of LUM protein expression by means of western blot in the control group and in hNPCs stimulated with TNF-α. N = 3. ***P < 0.001 vs. control. (b–c) Detection of the interference efficacy of si-LUM1/2 by means of RT-qPCR and western blot analysis in hNPCs. N = 3. **P < 0.01, ***P < 0.001 vs. si-NC. (d–f) The concentrations of pro-inflammatory cytokine levels in hNPCs stimulated with TNF-α or transfected with si-NC/si-LUM-1was examined with ELISA kits. (g–i) RT-qPCR was used to evaluate the mRNA expression of pro-inflammatory cytokine in hNPCs stimulated with TNF-α or transfected with si-NC/si-LUM-1. N = 3. ***P < 0.001 vs. control; ###P < 0.001 vs. TNF-α+ si-NC
Figure 2. LUM deletion alleviated TNF-α-induced cell cycle arrest and cellular senescence of hNPCs. Analysis of cell viability (a), cell cycle distribution (b-c) and the expression of cell cycle markers (d) by use of CCK-8, flow cytometry and western blot in hNPCs stimulated with TNF-α or transfected with si-NC/si-LUM-1. Analysis of senescent cells (e), telomerase activity (f) and the expression of senescence markers (g) by means of β-galactosidase staining, telomerase ELISA and western blot in hNPCs stimulated with TNF-α or transfected with si-NC/si-LUM-1. N = 3. ***P < 0.001 vs. control; #P < 0.05, ##P < 0.01, ###P < 0.001 vs. TNF-α+ si-NC
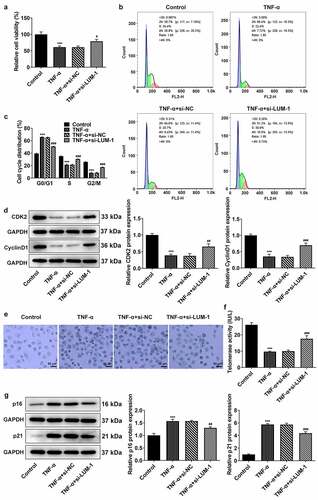
Figure 3. LUM silencing downregulated ASK1/P38 signaling pathway through FasL in TNF-α-induced hNPCs. (a) Detection of FasL expression level by western blot in hNPCs stimulated with TNF-α or transfected with si-NC/si-LUM-1. N = 3. ***P < 0.001 vs. control; ###P < 0.001 vs. TNF-α+ si-NC. (b–c) Detection of the overexpression efficacy of Oe-FasL by means of RT-qPCR and western blot assay. N = 3. ***P < 0.001 vs. Oe-NC. (d) The expression of phosphorylated ASK1 and p38 detected by western blot in TNF-α-stimulated hNPCs transfected with si-NC/si-LUM-1 or co-transfected with si-LUM-1 and Oe-NC/FasL. N = 3. ***P < 0.001 vs. control; ###P < 0.001 vs. TNF-α+ si-NC; ΔΔΔP<0.001 vs. TNF-α+ si-LUM-1+ Oe-NC
Figure 4. LUM silencing alleviated TNF-α-induced inflammatory response and cell cycle arrest of hNPCs by inhibiting ASK1/p38 signaling pathway via inactivating FasL expression. (a–c) The contents of pro-inflammatory cytokine was detected by ELISA in TNF-α-stimulated hNPCs transfected with si-NC/si-LUM-1 or co-transfected with si-LUM-1 and Oe-NC/FasL. Analysis of cell viability (d), cell cycle distribution (e–f) and the expression of cell cycle markers (g) by use of CCK-8, flow cytometry and western blot in TNF-α-stimulated hNPCs transfected with si-NC/si-LUM-1 or co-transfected with si-LUM-1 and Oe-NC/FasL. N = 3. **P < 0.01, ***P < 0.001 vs. TNF-α+ si-NC; #P < 0.05, ##P < 0.01, ###P < 0.001 vs. TNF-α+ si-LUM-1+ Oe-NC; ΔΔΔP<0.001 vs. TNF-α+ si-LUM-1+ Oe-FasL
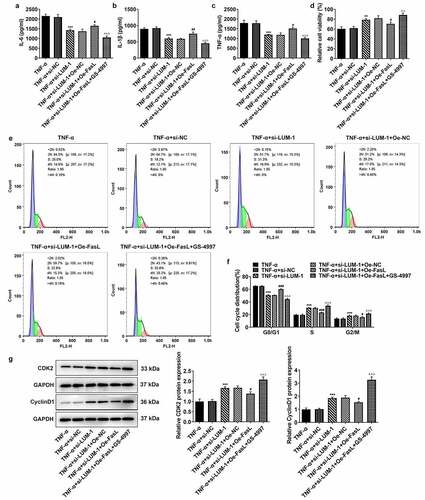
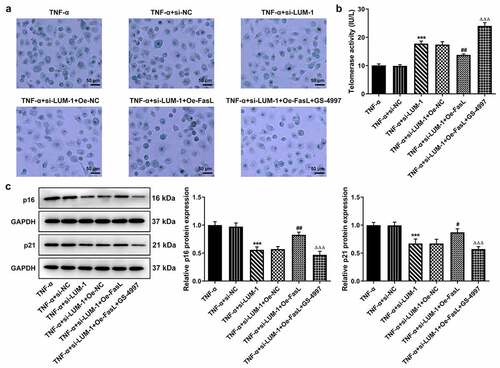
Figure 5. LUM silencing attenuated TNF-α-induced cellular senescence of hNPCs by inhibiting ASK1/p38 signaling pathway via inactivating FasL expression. Analysis of senescent cells (a), telomerase activity (b) and the expression of senescence markers (c) by means of β-galactosidase staining, telomerase ELISA and western blot in TNF-α-stimulated hNPCs transfected with si-NC/si-LUM-1 or co-transfected with si-LUM-1 and Oe-NC/FasL. N = 3. ***P < 0.001 vs. TNF-α+ si-NC; #P < 0.05, ##P < 0.01 vs. TNF-α+ si-LUM-1+ Oe-NC; ΔΔΔP<0.001 vs. TNF-α+ si-LUM-1+ Oe-FasL
Availability of data and materials
The datasets used and analyzed are available from the corresponding author on reasonable request.