
Figures & data
Table 1. The main targets of tetrandrine in the treatment of nephrotic syndrome (NS)
Figure 1. Venn diagram of targets for tetrandrine treating MGN
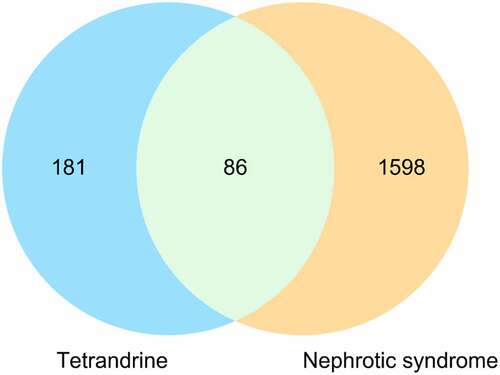
Figure 2. The nerwork of MGN-related targets
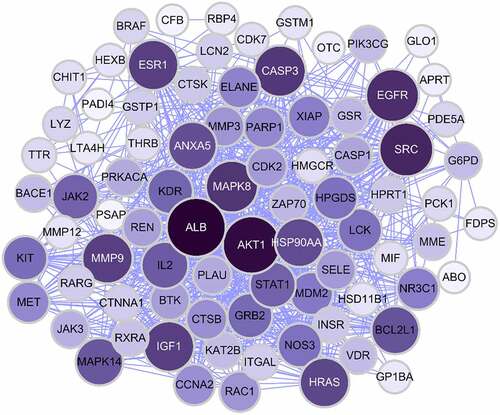
Table 2. The top 15 KEGG pathways of tetrandrine related target genes
Figure 3. GO and KEGG enrichment analysis. (a) The top 15 significantly enriched terms in biological process (BP); (b) The top 15 significantly enriched terms in cellular component (CC); (c) The top 15 significantly enriched terms in molecular function (MF); (d) The top 15 significantly enriched terms in KEGG pathway. Gene ratio = count/set size
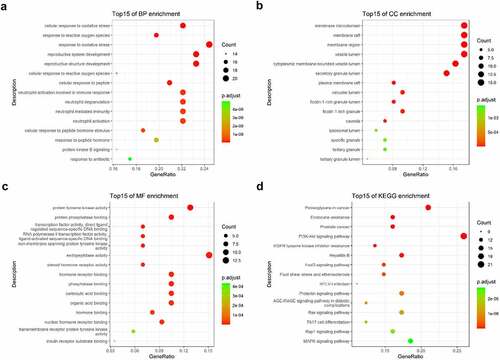
Figure 4. The PPI network of 10 hub genes. IGF1: Insulin-like growth factor 1; AKT1: AKT Serine/Threonine Kinase 1; CASP3: Caspase 3; HRAS: HRas Proto-Oncogene, GTPase; ESR1: Estrogen Receptor 1; MAPK8: Mitogen-Activated Protein Kinase 8; MMP9: Matrix Metallopeptidase 9; SRC: SRC Proto-Oncogene, Non-Receptor tyrosine kinase; EGFR: Epidermal Growth Factor Receptor; ALB: Albumin
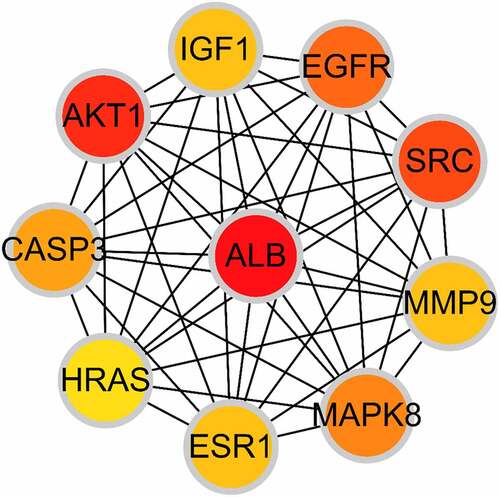
Figure 5. The top 15 GO terms of hub genes
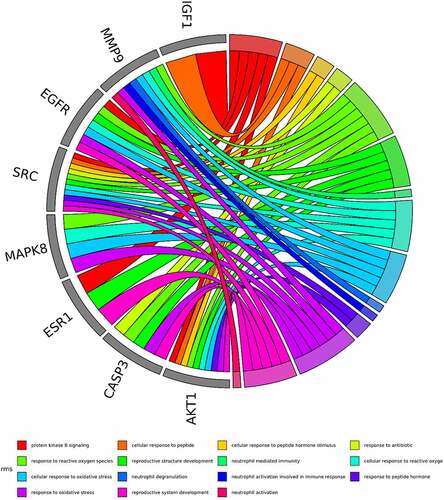
Figure 6. The top 15 pathways of hub genes
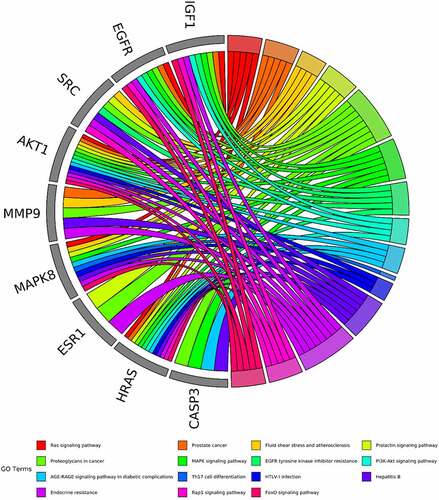
Figure 7. Compound action disease targets were associated with the top 15 KEGG pathways and the top 15 GO terms
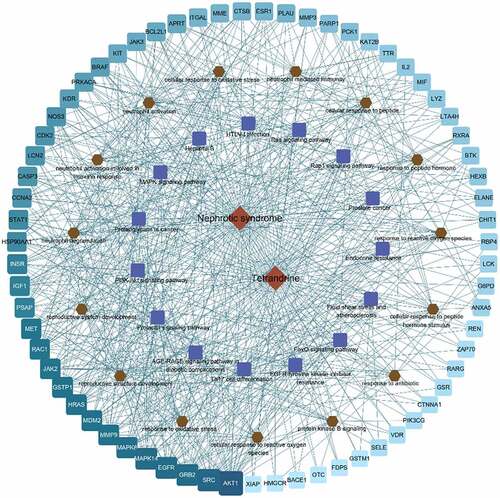
Figure 8. (a) The chemical structure of tetrandrine. (b) The 24 UP contents were detected after 7, 14, 21 and 28 days of tetrandrine treat in control, HN model and tetrandrine groups. (c) The representative images of the histology staining on the kidney tissue. (d) The representative images of TEM on the kidney tissue. **, P < 0.01 vs. control group; ##, P < 0.01 vs. model group
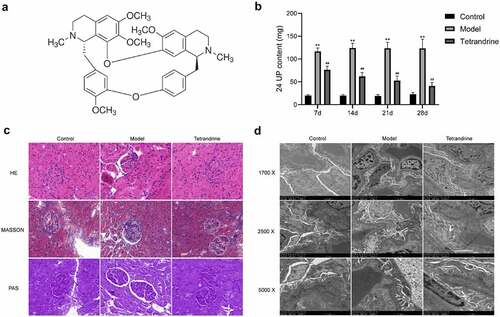
Figure 9. After 7, 14, 21 and 28 days of tetrandrine treat, the serum content of ALB (a), SCr (b), ALT (c) and AST (d) level in control, model and tetrandrine groups. *, P < 0.05 and **, P < 0.01 vs. control group; #, P < 0.05 and ##, P < 0.01 vs. model group
Table 3. The anti-oxidative effect of tetrandrine in Heymann nephritis (HN) rats
Figure 10. (a) Nephrin and podocin expression of kidney tissues were detected by immunofluorescence staining. (b) The kidney tissues cell apoptosis was analyzed via TUNEL
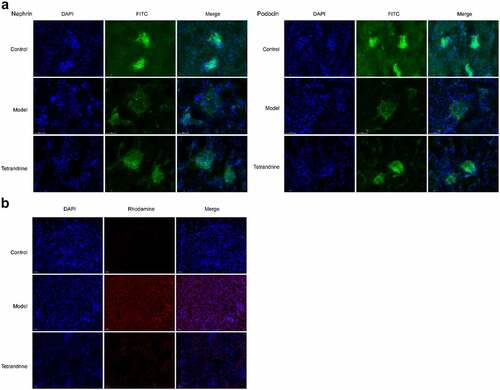
Figure 11. (a) The expression levels of IL-6, TNFα and MCP-1 in the kidney tissues were examined by qRT-PCR in control, model and tetrandrine groups rats. (b) The expression of p-PI3K, PI3K, Akt, p-Akt, p-BAD, Bcl-2 were examined by western blot in control, model and tetrandrine groups rats. **, P < 0.01 vs. control group; ##, P < 0.01 vs. model group
Data availability
The data used to support the findings of this study are available from the corresponding author upon request.