
Figures & data
Figure 1. The process of constructing circular RNA ceRNA network and looking for hub genes in CNI-ED
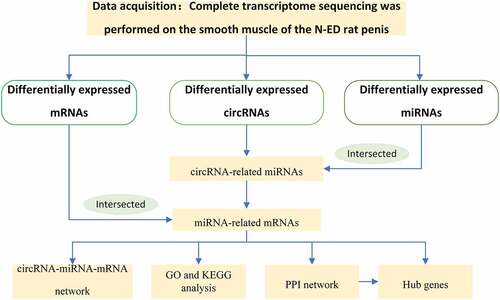
Table 1. The circRNA primer sequence
Figure 2. Differential expression of RNAs (a-c) The differences of circRNAs, miRNAs, and mRNA between the BNCI group and the normal control group were shown by heat map. High expression is shown in red and low expression in green
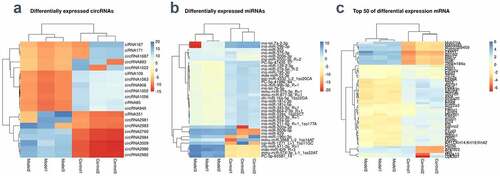
Figure 3. Validation of circRNA by RT-qPCR: Relative expression levels of differentially expressed circRNAs in model group and normal group. Mean ± SD, n = 3; The two-tailed Student t-test was used to assess statistical significance: *P < 0.05 and **P < 0.01 represent differential expression between the model group and normal group
Figure 4. The connections between circRNA, miRNA and mRNA (a) Blue represents miRNAs that are capable of spongy circRNAs predicted by CircInteractome, red represents the differential miRNAs obtained by RNA sequencing (p ≤ 0.1), and the overlaps represent the differentially expressed miRNAs that we ultimately need. (b) The red circle represents the predicted mRNA that can target all miRNAs, and the other colored circles represent the intersection of each miRNA’s predicted and actual sequencing results. Finally, we obtained 50 target genes of rno-let-7b-5p, 45 target genes of rno-miR-129-2-3p, 37 target genes of rno-let-7a-2-3p, 34 target genes of rno-miR-27b-5p_R-2, 12 target genes of rno-miR-99b-3p_R + 1, and 12 target genes of rno-miR-345-5p_R + 1
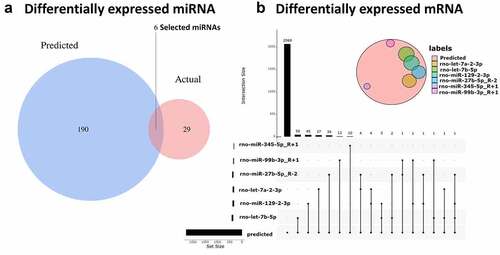
Figure 5. ceRNA network (a) Upregulated circRNA ceRNA network. The red diamonds stand for upregulated circRNAs, the green triangles represent down-regulated miRNAs, and the blue ovals denote upregulated miRNAs. (b) Down-regulated circRNA ceRNA networks in CNI-ED
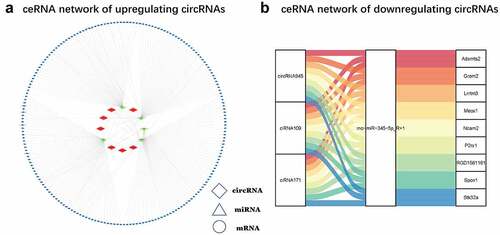
Figure 6. GO and KEGG analysis (a) The top 20, 15, and ten most meaningful GO terms in BP, CC, and MF in CNI-ED. orange bars represent MF terms. Blue bars represent CC terms. Light green bars represent BP. (b) Pathway prediction of KEGG analysis. The larger the circle, the greater the number of enriched genes. The redder the color, the higher the significance of enrichment pathway. (c) The pathways correlation in the ceRNA network. Red circles represent pathways associated with energy metabolism, and the black circles represent the genes associated with these pathways. (d) The number of genes contained in each pathway of interest. A circle represents a gene, red up and blue down
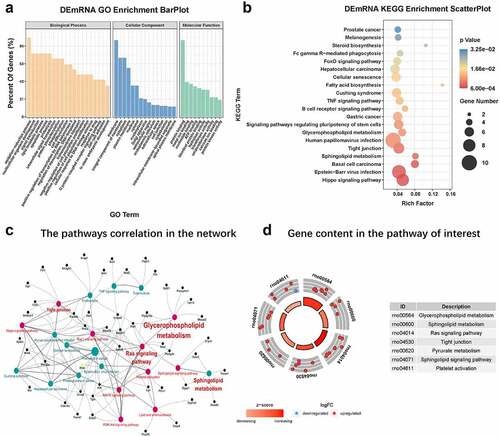
Figure 7. PPI network (a) The network is generated by String and the graph is generated by Cytoscope. The pale green oval represents an mRNA, and the lines represent a connection between the two mRNAs. (b) Nodes rank top 30 mRNAs in the network
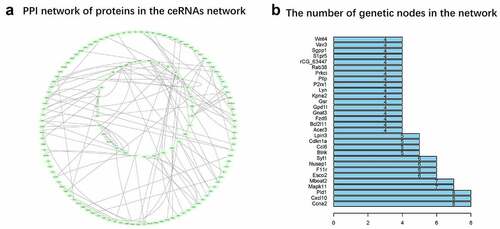
Table 2. The ability of DE circRNAs encoding protein and the conservation
Supplemental Material
Download ()Data Availability Statement
The raw data supporting the conclusions of this article will be made available by the authors, without undue reservation.
The sequencing results have been uploaded to the GEO database: GSE176099 study at:https://www.ncbi.nlm.nih.gov/geo/query/acc.cgi?acc=GSE176099