Figures & data
Table 1. Housekeeping Gene (mouse β-actin) and targeted gene expression primer sequences
Table 2. Renal cadmium concentration
Figure 1. Hematoxylin and eosin (H &E) staining of renal in CdCl2 exposure after the treatment with fucoxanthin and Shenfukang tablets supplementation (1) the control group: no CdCl2 administration; (2) NCG, negative control group, only CdCl2 treatment; (3) PCG, positive control group, CdCl2+ Shenfukang tablets; (4) F1, CdCl2 + 10 mg/kg fucoxanthin body weight for 14 day treatment ; (5) F2, CdCl2 + 25 mg/kg body weight fucoxanthin; (6) F3,CdCl2 + 50 mg/kg body weight fucoxanthin. Each group used 20 mice
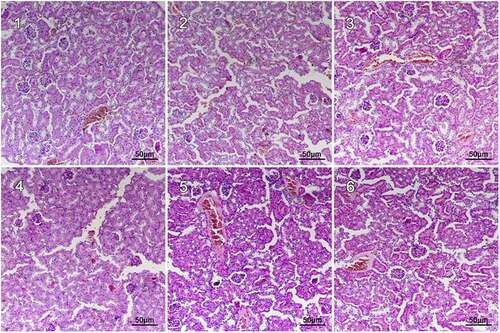
Figure 2. The quantity of the cross-sectional area of the glomeruli (μm2) Single factor analysis of variance between multiple groups was performed using Duncan methods. ‘*’ compared with the control group, P < 0.05; ‘#’ compared with the negative control group, P < 0.05; ‘^’ compared with the positive control group, P < 0.05. Each group used 20 mice
Figure 3. The semi-quantitative score of renal tubular damage in mice Single factor analysis of variance between multiple groups was performed using Duncan methods. ‘*’ compared with the control group, P < 0.05; ‘#’ compared with the negative control group, P < 0.05. Each group used 20 mice
Figure 4. Ultrastructural changes after treatment with fucoxanthin and Shenfukang tablets administration (1) Control group, (2) NCG, (3) PCG, (4) F3, (a) mitochondria damage, (b) karyopyknosis, and (c) mitochondrial rupture. Each group used 20 mice
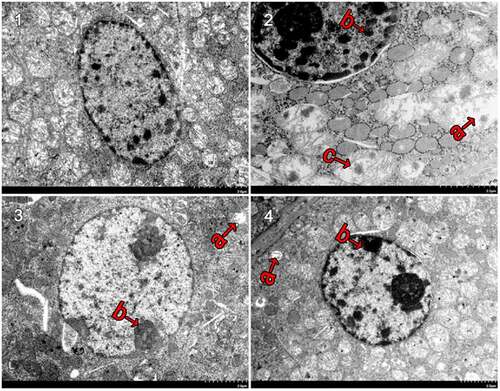
Figure 5. Semi-quantitative evaluation of mitochondrial damage in mouse kidney cells Single factor analysis of variance between multiple groups was performed using Duncan methods.‘*’ compared with the control group, P < 0.05; ‘#’ compared with the negative control group, P < 0.05. Each group used 20 mice
Table 3. Changes in the BUN, KIM-1 and NGAL levels
Figure 6. Changes in Renal POD, SOD, CAT and APX Activities (U/g) Single factor analysis of variance between multiple groups was performed using Duncan methods. ‘*’ compared with the control group, P < 0.05; ‘#’ compared with the negative control group, P < 0.05; ‘^’ compared with the positive control group, P < 0.05. Each group used 20 mice
Figure 7. Effect of fucoxanthin on the expression of apoptosis-associated genes in the cadmium kidney-damaged mouse model Single factor analysis of variance between multiple groups was performed using Duncan methods.‘*’ compared with the control group, P < 0.05; ‘#’ compared with the negative control group, P < 0.05. Each group used 20 mice