Figures & data
Figure 1. SQJZJN effectively improved CRF symptoms. A-B, Appearance and average weight of rat kidneys in the normal control, model, and SQJZJN treatment groups from left to right. C, Weight of the rats. D, Content of Cr. E, Content of BUN. F, Content of UA. ##, p < 0.01
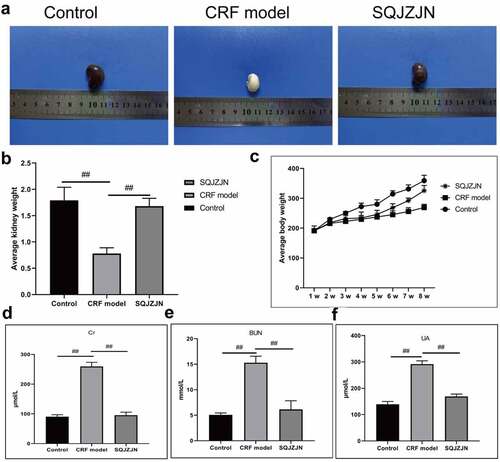
Figure 2. Network pharmacological analysis of SQJZJN-ingredients-targets-disease. A, Overlapped genes of the corresponding component targets of SQJZJN and CRF associated target genes. B, Overlapped genes between Polygonum cuspidatum Siebold & Zucc (Huzhang), Smilax glabra Roxb. (Tufuling), Sophora japonica L. (Huaihua), and Astragalus membranaceus (Fisch.) Bunge (Huangqi) and the disease targets. C, PPI network diagram. D, Network diagram of drug-active ingredients-target genes. E, Target gene enrichment chart
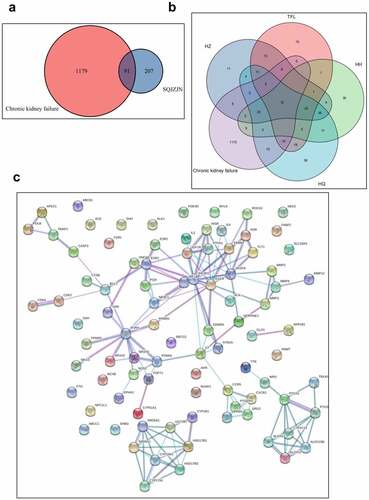
Figure 2. Continued
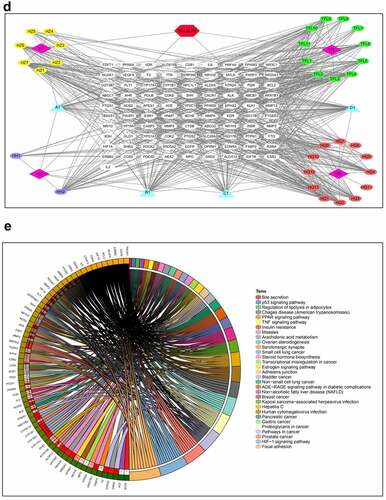
Figure 3. Effective treatment of Quercetin to CRF. The rats by intragastric administration of Quercetin were divided into a normal control group, a model group, a low dose Quercetin group, a medium dose Quercetin group, and a high dose Quercetin group (n = 5). The CRF rats were intragastrically administered Quercetin daily at doses of 0.75, 1.5, and 3 g/(kg·d) according to the body weight for 8 weeks. A, Content of Cr. B, Content of BUN. C, Content of UA. D, HE staining. E, Detection of cell apoptosis by flow cytometry. #, p < 0.05. ##, p < 0.01
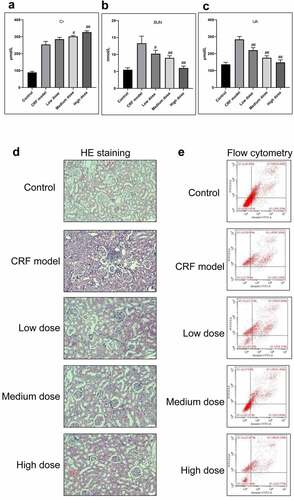
Figure 4. Regulatory effects of Quercetin on CRF genes and proteins. A-D, Expression of NLRP3, caspase1, AQP1, and AQP2 was detected by immunofluorescence. E, Statistical results of the average fluorescence intensity. F-G, Expression of p-PI3K, p-AKT, NLRP3, Caspase1, AQP1, and AQP2 by western blot. H, Grayscale statistical results of western blot. #, p < 0.05. ##, p < 0.01. Scale bar: 50 μm
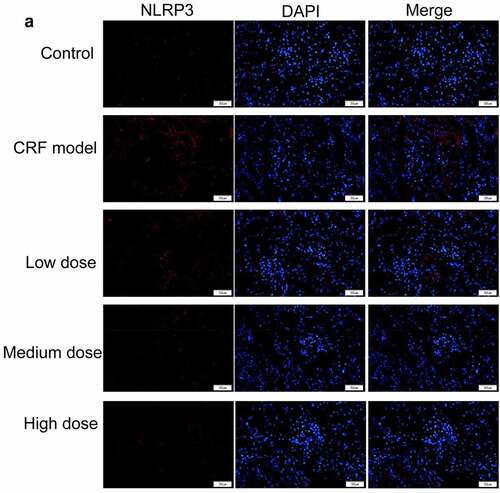
Figure 4. Continued
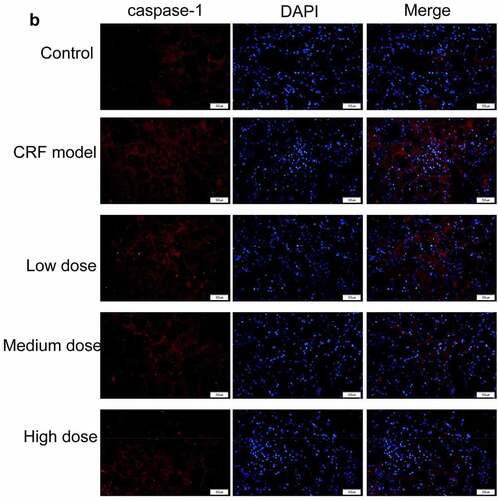
Figure 4. Continued
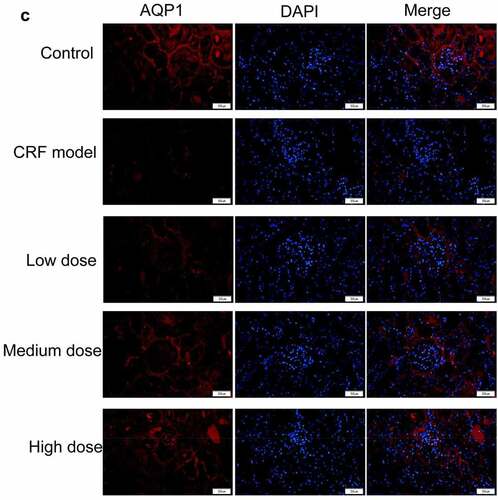
Figure 4. Continued
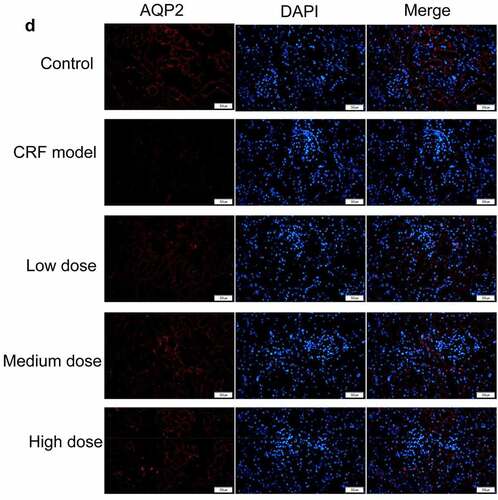
Figure 4. Continued
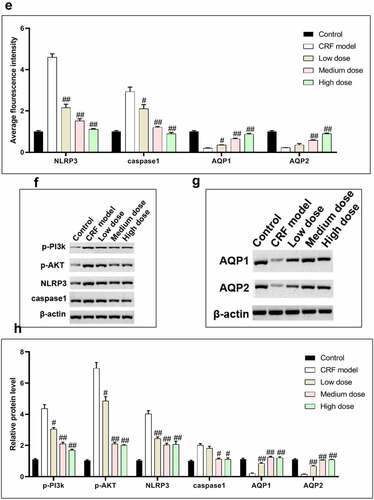
Figure 5. Quercetin treats CRF by regulating PIK3R1. A, PIK3R1 results by western blot after biotin-labeled Quercetin incubated with total kidney protein. B-C, Average weight and appearance of rat kidney after interfering PIK3R1. From left to right, the model group+si-NC, the model group+si-PIK3R1 group. D, HE staining. E, Content of Cr. F, Content of BUN. G, Content of UA. #, p < 0.05. ##, p < 0.01
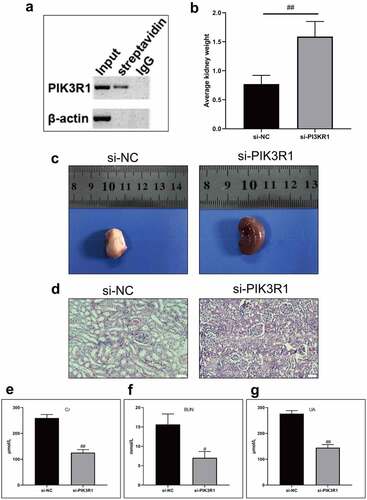
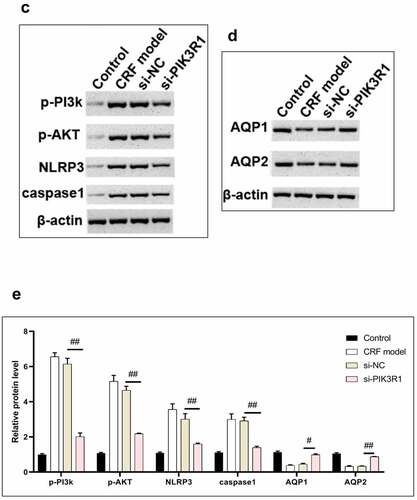
Figure 6. Regulatory effects on CRF genes and proteins by interfering PIK3R1. A, Expression of NLRP3 and caspase1 was detected by immunofluorescence. B, Expression of AQP1 and AQP2 was detected by immunofluorescence. C-D, Expression of p-PI3K, p-AKT, NLRP3, caspase1, AQP1, and AQP2 was detected by western blot. E, Grayscale statistical results by western blot. #, p < 0.05. ##, p < 0.01. Scale bar: 50 μm
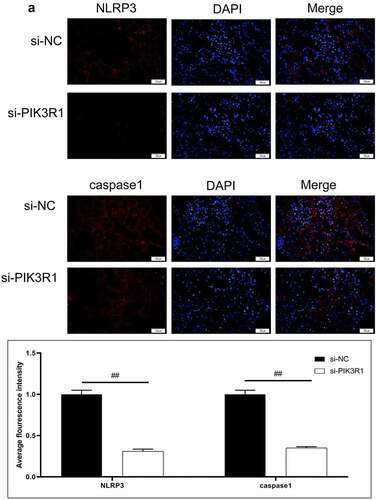
Figure 6. Continued
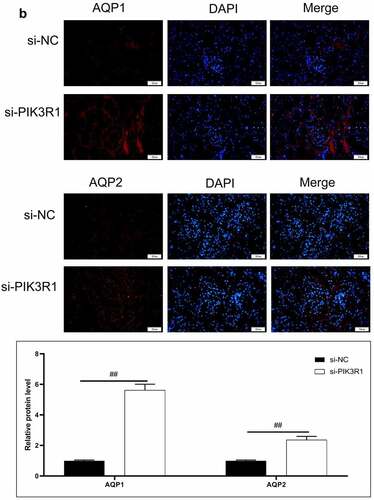
Figure 6. Continued