
Figures & data
Table 1. Primer sequences for RT-qPCR
Figure 1. MiR-495 expression profile and Kaplan–Meier survival curves of HCC patients. (a) MiR-495 expression in tumor tissues was subjected to real-time PCR and the expression of U6 small nuclear RNA was standardized, n = 118. (b) MiR-495 expression in HCC cells was subjected to real-time PCR and the expression of U6 small nuclear RNA was standardized. (c) Kaplan–Meier survival curves for disease-free survival of the HCC patients. the patients were grouped to high- and low-expression groups based on mir-495 level. log-rank tests were used for data comparison. all of the experiments were repeated at least three times. **P < 0.01, ***P < 0.001
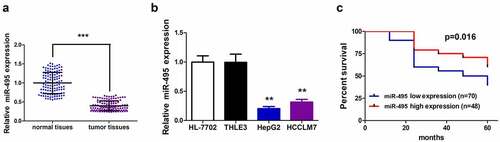
Figure 2. MiR-495 inhibits cell growth and induces senescence in HCC cells. (a) cell viability assays were performed for HepG2 and Huh-7 cells were transfected with miR-495 (blue line) or negative control vector (dark line) at indicated time. (b-c) The EdU incorporation assay was performed to analyze the proliferation ability of HepG2 and Huh-7 cells transfected with miR-495 or negative control vector. (d-e) Cell cycle was assessed in HepG2 and Huh-7 cells transfected with miR-495 or negative control vector by propidium iodide staining using flow cytometry. (f-g) senescence was measured by SA-β-gal staining in miR-495 transfected HCC cells. a, b, e and f displayed figures of 100× magnification. c, d, g and h displayed figures of 200× magnification depicting changes in morphology. The data were calculated as the average of triplicate values. ** represented P < 0.01
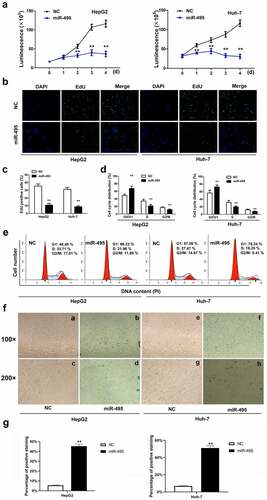
Figure 3. CTRP3 is a direct target of miR-495. (a) sequence alignment between miR-495 and the 3ʹ-UTR of the human CTRP3 mRNA. (b) The luciferase activities of wt/mutant CTRP3 3ʹ-UTR reporter constructs was analyzed in HCC cells transfected with miR-495 or miR-NC. (c) The mRNA levels of CTRP3 in HCC cells were analyzed using real-time PCR and standardized against β-actin. (d) CTRP3 protein levels were subjected to western blotting. (e) The mRNA levels of CTRP3 were profiled in tumor tissues and normal tissues (n = 20). **P < 0.01, ***P < 0.001
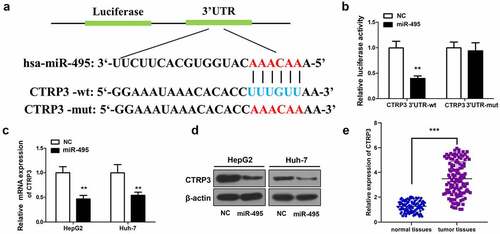
Figure 4. The inhibitory effect of miR-495 overexpression is through targeting CTRP3. (a) The protein levels of CTRP3 were identified using western blot assay in HCC cells transfected with indicated plasmid. (b) after indicated plasmid was transfected into HCC cells, and the cell growth was determined using CCK-8 assay. (c) the cell proliferation ability was determined using EdU incorporation assay in HCC cells transfected with indicated plasmid. (d) the cell cycle profile was measured via propidium iodide staining using flow cytometry. (e) cellular senescence was measured via SA-β-gal staining after transfection of HCC cells. (f) after HCC cells were transfected with indicated plasmid (200 ng/mL of pEZ-M02-CTRP3 or pEZ-M02; 50 nM miR-495 mimics), and the cell viability was measured by CellTiter96 assay kit. (g) CTRP3 protein expression was detected by western blot. **P < 0.01
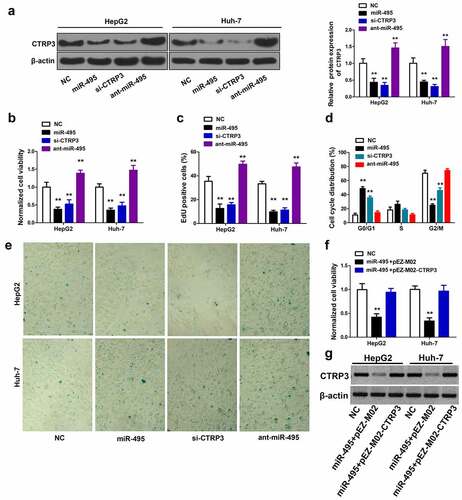
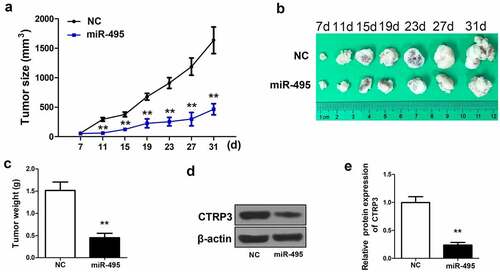
Figure 5. MiR-495 suppresses tumor growth in vivo. (a) A microcaliper was employed to measure tumor size every 4 days 7 d after injection, and calculated as (length×width2)/2 (60 BALB/C female athymic nude mice, aged 5–6 weeks,). (b) the tumor size at 7 d, 11 d, 15 d, 19 d, 23 d, 27 d and 31 d. (c) the weight of the tumors after 31 days was determined. (d) protein level of CTRP3 in tumors was determined via western blotting. (e) the protein levels of CTRP3 was quantified and shown in histogram. **P < 0.01
Supplemental Material
Download ()Availability of data and materials
All data generated or analyzed during this study are included in this published article.