
Figures & data
Table 1. Relationship between OTX1 and clinic-pathological parameters
Figure 1. OTX1 was overexpressed in BC. (a). Hierarchical clustering analysis of different genes in Normal samples and Tumor samples. (b). Volcano plot. The red dots represent up-regulated differentially expressed genes (DEGs), while the blue dots represent down-regulated DEGs (based on > 2-fold changes). (c). Venn diagram showed the distribution of DEGs in different groups. (d). Comparison of OTX1 in normal and bladder cancer tissues based on RNA-seq. (e). The mRNA level of OTX1 was detected by qPCR in HCV-29, BT-B, EJ, HT-1376 and SCaBER. (**p < 0.05, ***p < 0.001 vs. HCV-29 cells) (f). The protein level of OTX1 was measured by western blotting in HCV-29, BT-B, EJ, HT-1376 and SCaBER. (g). The expression of OTX1 was measured by IHC in para-cancerous tissue and cancer tissue
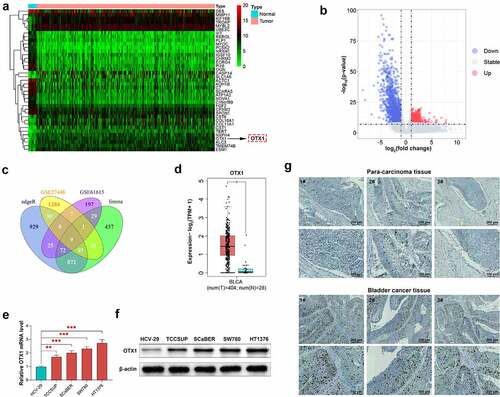
Figure 2. OTX1 was involved in poor prognosis of patients with BC. OS was calculated by Kaplan-Meier analysis. Patients with BC were divided into two groups based on the expression of OTX1. (a). Relationship between OTX1 expression and OS or DFS by mean optical density. (b). OS by rating level
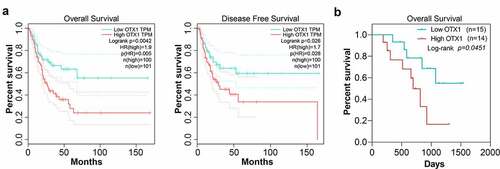
Figure 3. OTX1 promoted the growth and motility of BC cells in vitro. HT1376 cells were transfected with shRNA-negative control (sh-NC) and shRNAs targeting OTX1 (sh-OTX1#1 and sh-OTX1#2). TCCSUP cells were transfected with empty-vector or OTX1-vector1. (a). The mRNA level of OTX1 was detected by qPCR in HT1376 and TCCSUP cells. (b). The protein level of OTX1 was measured by western blotting in HT1376 and TCCSUP cells. (c). Viability of HT1376 and TCCSUP cells was measured by MTT assay. (d). Cell growth was measured by clone formation assay. (e). Cell migration was measured by Wound healing assay. (f). Cell invasion was measured by Transwell assay. (**p < 0.05, ***p < 0.001 vs. HT1376 cells transfected with sh-NC or TCCSUP cells transfected with empty-vector)
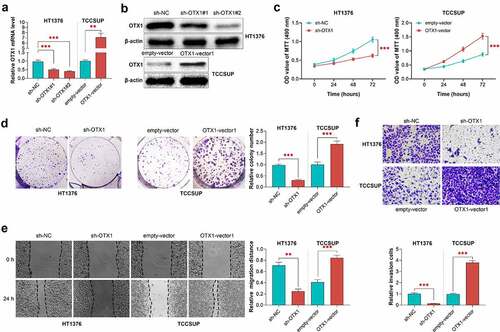
Table 2. The co-expressed genes with OTX1 in BC
Figure 4. OTX1 promoted cell cycle progression of BC cells. (a). GO analysis showed that OTX1 co-expressed genes were enriched in cell cycle. (b-c). KEGG and Reactome analysis showed that cell cycle-related pathways were significantly associated with OTX1 gene in bladder cancer
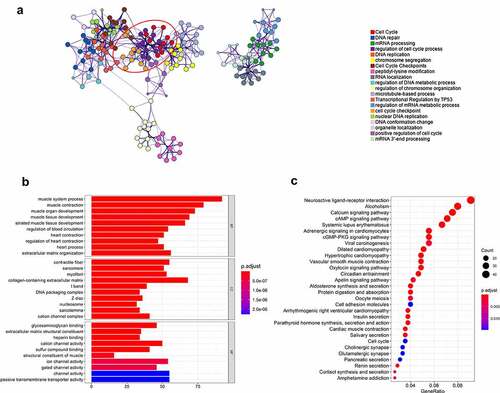
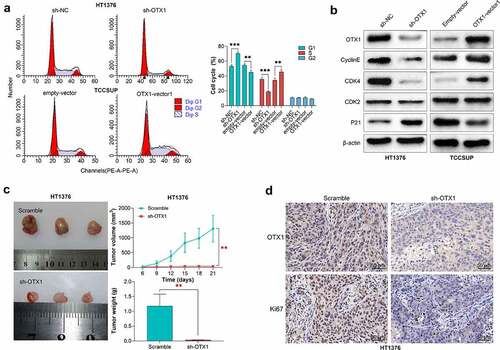
Figure 5. OTX1 silencing inhibited tumor growth in vivo. HT1376 cells were transfected with shRNA-negative control (sh-NC) and shRNAs targeting OTX1 (sh-OTX1#1). TCCSUP cells were transfected with empty-vector or OTX1-vector1. (a). Cell cycle was detected by flow cytometry analysis. (b). The protein levels of OTX1, CyclinE, CDK4, CDK2 and P21 were measured by western blotting. (c-d). Un-transfected HT1376 cells and HT1376 cells transfected with sh-OXT1 (3 × 10⁶) were injected into the flank region of mice. (c). The volume and weight of tumors. (d). The expression of OTX1 and Ki67 in tissues was detected by IHC
Supplemental Material
Download ()Availability of data and materials
All data generated or analyzed during this study are included in this published article.