
Figures & data
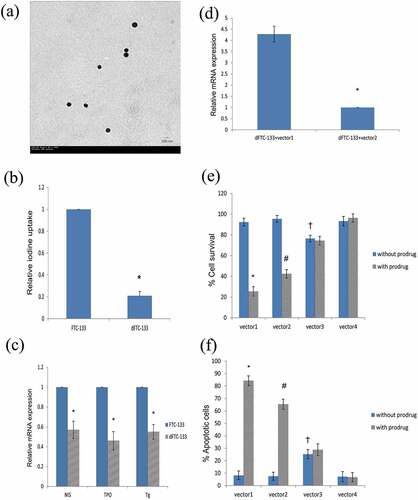
Figure 1. (a) Transmission electron microscopic image of the constructed nanoparticles (vector1). (b) The radioiodine uptake was lower in dFTC-133 cells than that in FTC-133 ones (*P < 0.05, FTC-133 vs dFTC-133). (c) Relative mRNA expression of the thyroid specific markers were decreased in dFTC-133 cells relative to FTC-133 cells, respectively (*P < 0.05, FTC-133 vs dFTC-133 in each comparison). (d) The expression level of CD/TK mRNA was significantly higher in dFTC-133+ vector1 than that in dFTC-133+ vector2 (*P < 0.05, ‘dFTC-133+ vector2ʹ vs ‘dFTC-133+ vector2ʹ). (e-f) Marked difference between ‘with prodrug’ and ‘without prodrug’ groups can be shown in vector1 and vector2 group, respectively (*P < 0.05, #P < 0.05, ‘with prodrug’ vs ‘without prodrug’ in each subgroup). Nevertheless, increased cell apoptosis and decreased cell viability can be observed in cells transfected with vector1 compared with those with vector2 (* vs #, P < 0.05, ‘with prodrug’ in ‘vector1ʹ vs ‘vector2ʹ). Increased cell apoptosis and decreased cell viability were observed in vector3 group compared with vector4, regardless of prodrug treatment (†P < 0.05, ‘vector3ʹ vs ‘vector4ʹ in each subgroup)
Data availability statement
All data generated or analyzed during this study are included in this published article.