
Figures & data
Figure 1. Flow chart of the present study
Table 1. Clinical characteristics of GSE108735
Figure 2. Identified DERNAs from GEO and TCGA. (a) 113 upregulated differentially expressed circular RNAs were identified from GSE108735. (b) 56 differentially expressed microRNAs with 39 upregulated ones and 17 downregulated ones were identified from The Cancer Genome Atlas (TCGA). (c) 3807 differentially expressed messenger RNAs with 2865 upregulated ones and 942 downregulated ones were identified from TCGA
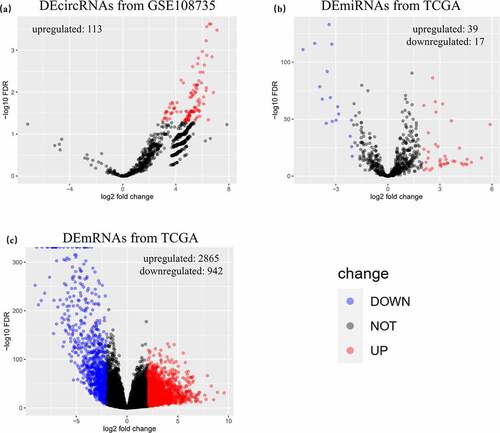
Figure 3. WGCNA of the DEmRNAs. (a) Analysis of network topology for different soft-thresholding powers. (b) 11 coexpression gene modules of more than 20 genes each were demonstrated in the clustering dendrogram with assigned module colors. (c) In the correlation of mRNA coexpression network modules with clinical prognostic factors of RCC, red module had a significant positive correlation with tumor malignancy (grade and stage) and negative correlation with survival time
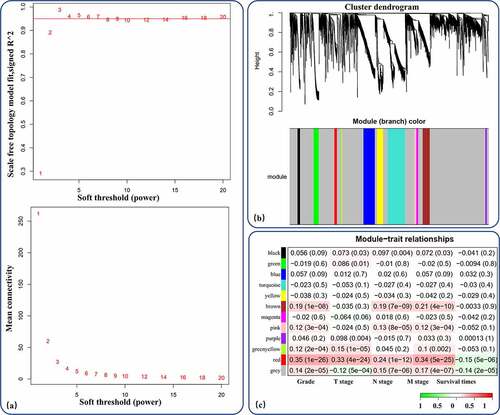
Figure 4. GO annotation analysis and KEGG pathway enrichment analysis of proDEmRNAs. (a)Terms enriched in biological processes of Gene ontology (GO) enrichment analysis were as follows: nuclear division, organelle fission, mitotic nuclear division, chromosome segregation, regulation of mitotic nuclear division, regulation of nuclear division, sister chromatid segregation, nuclear chromosome segregation, mitotic sister chromatid segregation, regulation of mitotic cell cycle phase transition, cell cycle checkpoint, cytokinesis, regulation of cell cycle phase transition, cell cycle G2/M phase transition, positive regulation of cell cycle process, negative regulation of mitotic cell cycle, negative regulation of cell cycle process, positive regulation of cell cycle. (b) Terms enriched in cellular components of GO enrichment analysis were as follows: condensed chromosome, spindle, microtubule. (c) Pathways enriched in Kyoto Encyclopedia of Genes and Genomes analysis were cell cycle, oocyte meiosis and progesterone-mediated oocyte maturation
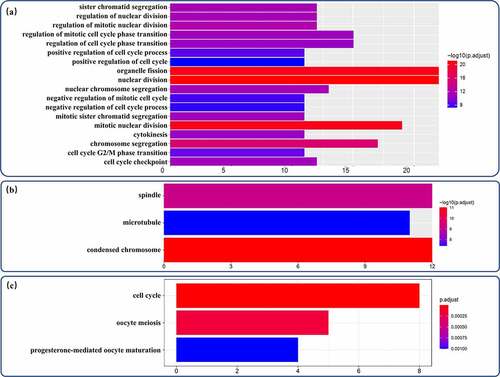
Figure 5. Overlapping interactions derived from the intersection analysis of TargetScan, miRanda and RNAhybird. (a) Networks of differentially expressed circular RNAs (DEcircRNAs) to differentially expressed microRNAs (DEmiRNAs) contained 1174 interactions in TargetScan, 1532 interactions in miRanda and 307 interactions in RNAhybird. A total of 39 overlapping interactions of DEcircRNAs to DEmiRNAs were identified with Venn intersection analysis. (b) Networks of DEmiRNAs to prognostic differentially expressed messenger RNAs (proDEmRNAs) contained 871 interactions in TargetScan, 1136 interactions in miRanda and 305 interactions in RNAhybird. A total of 120 overlapping interactions of DEmiRNAs to proDEmRNAs were identified with Venn intersection analysis
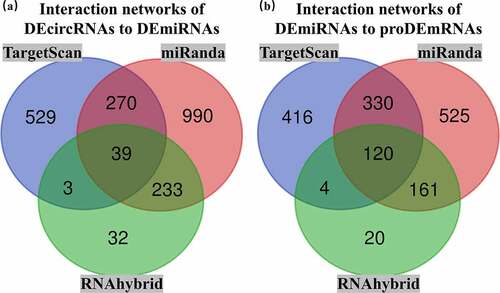
Figure 6. The circRNA-miRNA-mRNA ceRNA network
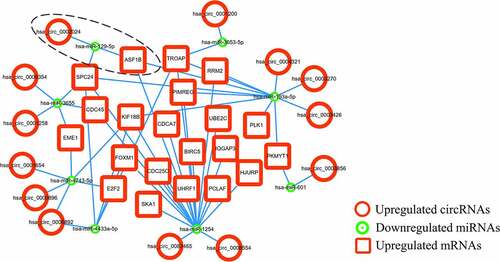
Figure 7. Pooled comparative analysis of the mRNA expression in Oncomine database
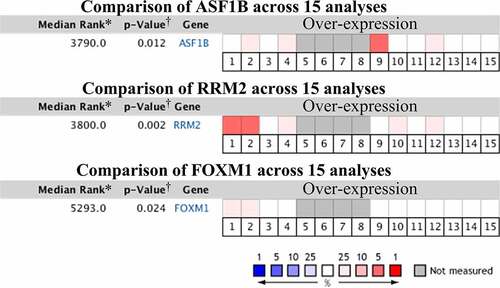
Figure 8. Box-plots of mRNA expression between RCC and normal kidney in GEPIA database
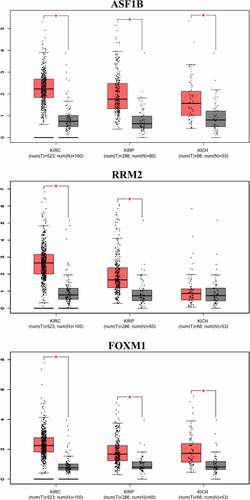
Figure 9. Relative expression of ASF1B and FOXM1 in q-PCR
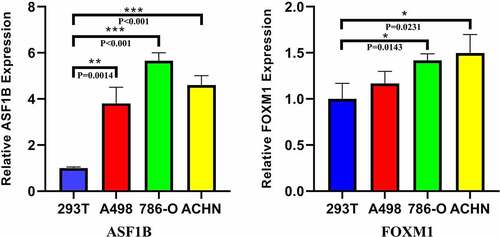
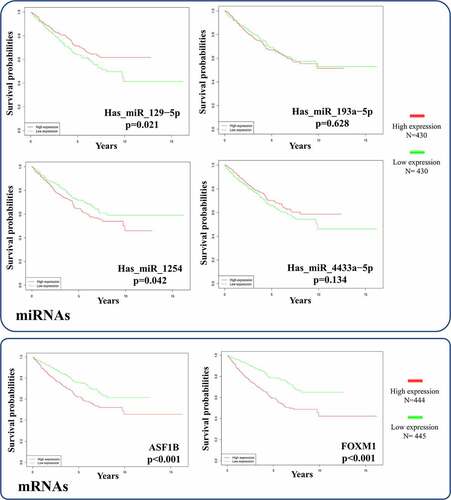
Figure 10. Survival analysis of the significant mRNAs and correlative miRNAs in the ceRNA network
Supplemental Material
Download ()Data availability statement
The datasets analyzed for this study can be found in the GEO database (www.ncbi.nlm.nih.gov/geo), TCGA database (cancergenome.nih.gov), Oncomines database (www.oncomine.org) and GEPIA database (gepia.cancer-pku.cn).