
Figures & data
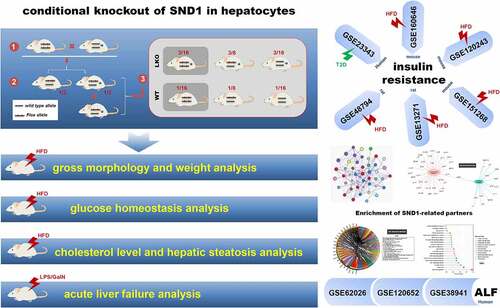
Figure 1. Construction of SND1 LKO mice
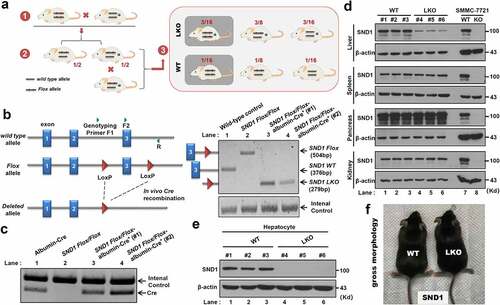
Figure 2. Effect of SND1 hepatocyte-specific deletion on weight of mice
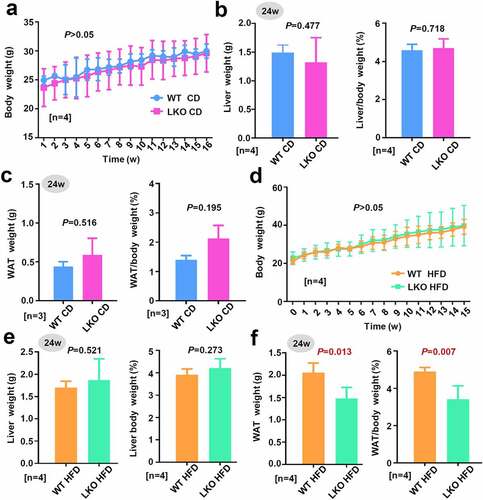
Figure 3. Effect of SND1 hepatocyte-specific deletion on Akt pathway
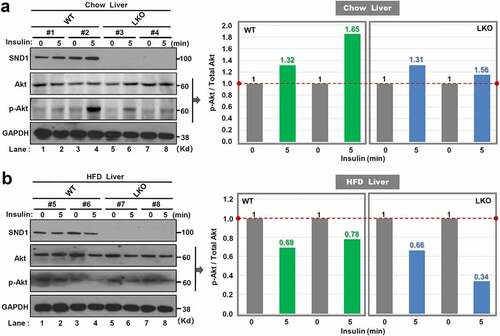
Figure 4. Effect of SND1 hepatocyte-specific deletion on glucose homeostasis of mice
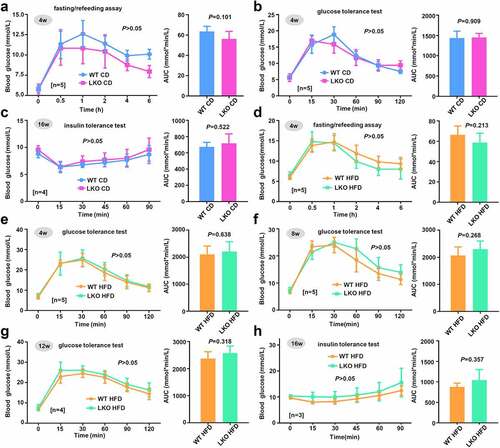
Figure 5. Cholesterol level and hepatic steatosis in WT and LKO mice with a high-fat diet
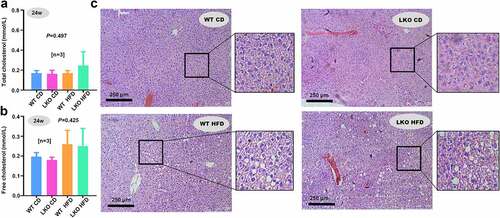
Figure 6. Effect of SND1 hepatocyte-specific deletion on acute liver failure induced by LPS/D-GalN
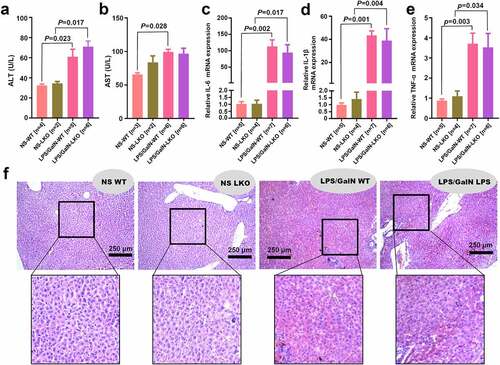
Figure 7. SND1 expression in liver tissues of insulin resistance-related GEO datasets
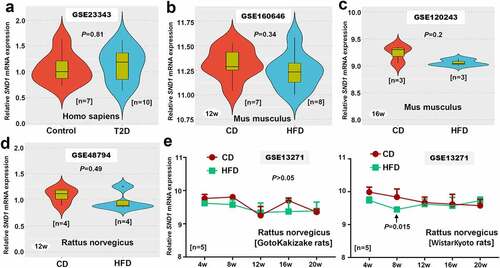
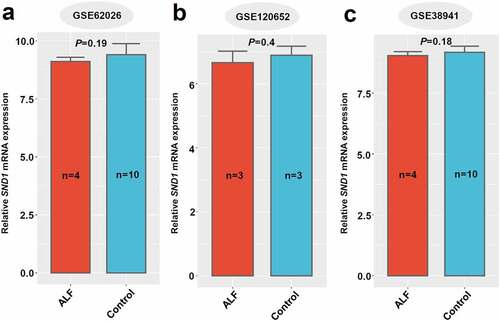
Figure 8. SND1 expression in liver tissues of ALF-related GEO datasets
Supplemental Material
Download ()Availability of data and materials
The datasets used and/or analyzed during the current study are available from the corresponding author on reasonable request. The authors gratefully acknowledge the contributions of datasets within GEO database, including GSE23343, GSE160646, GSE120243, GSE48794, GSE13271, GSE151268, GSE62026, GSE120652, GSE38941.