
Figures & data
Table 1. Summary of patients’ demographic and clinical characteristics in all datasets
Figure 1. K-M analyses showing the predictive capability of three types of scores with the prognosis of LUAD patients. (a) comparison of OS rate in high versus low ImmuneScore groups. (b) comparison of OS rate in high versus low StromalScore groups. (c) comparison of OS rate in high versus low ESTIMATEScore groups
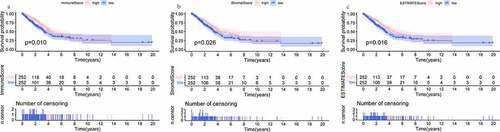
Figure 2. Scatter plots represent the association between the three scores of TME and clinical indicators (age, gender, AJCC stage, T stage, N stage, and M stage). (a-f) The distribution of ImmuneScore. (g-l) the distribution of StromalScore. (m-r) the distribution of ESTIMATEScore
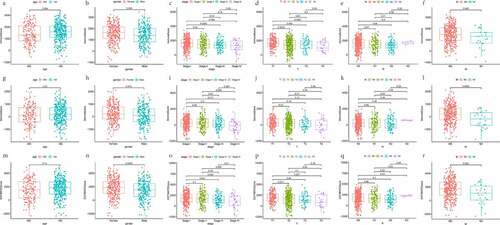
Figure 3. The display of DEGs among different groups. (a, b) heatmaps revealed DEGs by comparing high- and low-score groups in ImmuneScore and StromalScore, respectively. The abscissa represents the ID of patient samples, and the ordinate represents the name of DEGs. The top 50 DEGs were listed. (c, d) venn diagrams were depicted for upregulated and downregulated DEGs based on shared genes in ImmuneScore and StromalScore groups, respectively. (e) venn plot showed the overlap of immunologically relevant genes and TME-specific genes
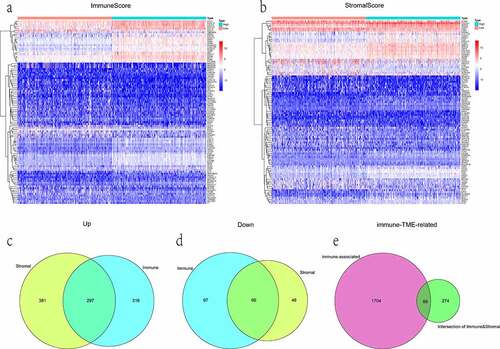
Table 2. The parameters for establishing the multivariate Cox proportional hazards regression signature
Figure 4. Evaluation and validation of the risk prognostic signature. (a) RiskScore distribution, survival overview, and heatmap for patients in the TCGA-LUAD dataset assigned to high- and low-risk groups based on the RiskScore median. (b) heatmap of the correlation between the two groups and clinicopathological parameters. *: P < 0.05, **: P < 0.01, ***: P < 0.001. (c, d) K-M survival and time-dependent ROC analyses were performed to predict the prognosis and the efficiency of the risk signature for high-/low-risk groups in training and validation datasets, respectively. (e, f) univariate/multivariate Cox regression analyses showing the independent prognostic value of RiskScore in TCGA-LUAD
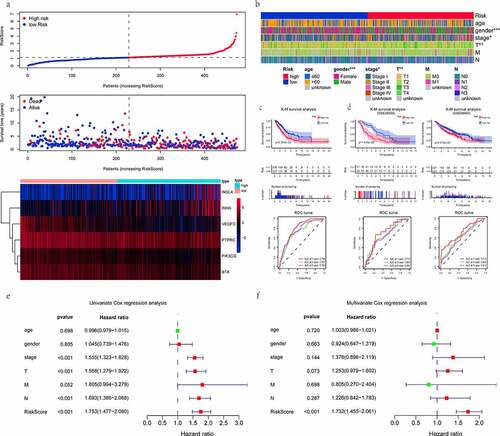
Figure 5. The relationship between the RiskS of our prognostic signature and the proportion of TIICs in the training dataset. (a) histograms showing 21 kinds of TIICs profile for each LUAD patients. The lateral axis represents sample ID and the longitudinal axis represents the relative percent of different types of TIICs. (b) correlation matrix displaying the pairwise correlation between 21 kinds of TIICs. Color or number in each cell depicting the corresponding correlation and P-value between two kinds of TIICs, respectively. (c) violin plots visualizing the infiltration fractions of 21 kinds of TIICs between high- and low-risk groups. The horizontal and vertical coordinates represent the name and relative content of TIICs, respectively. (d) the correlation between the RiskScore and significantly different 15 types of TIICs
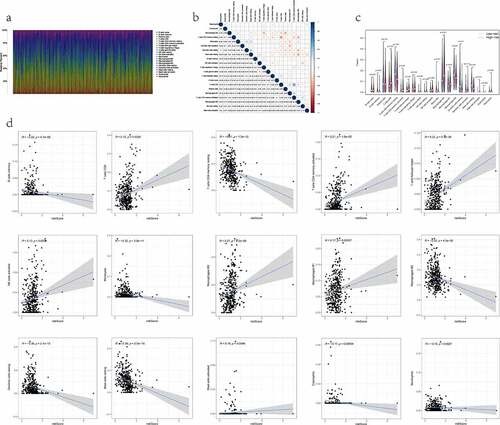
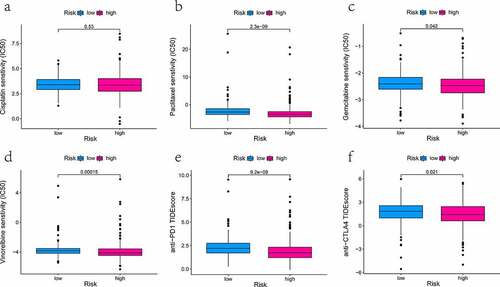
Figure 6. The effectiveness analysis of different types of medication at high- and low-risk group in TCGA-LUAD patients
Data availability statement
Any datasets generated and/or analyzed contributing to the conclusions of this article were retrieved from TCGA (https://portal.gdc.cancer.gov/) and GEO (https://www.ncbi.nlm.nih.gov/geo/).