Figures & data
Table 1. RT-qPCR primer sequences
Table 2. Correlation analysis of circCNOT2 and clinicopathological characteristics of BC patients
Figure 1. Up-regulated circCNOT2 in BC is linked with poor prognosis. A: RT-qPCR to detect circCNOT2 expression in BC tissue samples and adjacent normal tissues; B: RT-qPCR to detect circCNOT2 expression in MCF-10A and MCF-7 and SKBR-3; C: Prognostic chart of patients with high-expression circCNOT2 and low-expression circCNOT2. Values presentation was detailed in mean ± SD (n = 3). Via one-way ANOVA to calculate the significance of each group, the variance correction was done via Tukey’s test. *P < 0.05
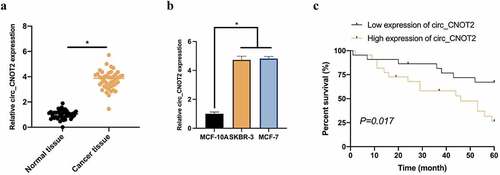
Figure 2. CircCNOT2 knockdown effectively prevents BC invasion, migration and EMT. A: RT-qPCR to detect the impact of circCNOT2 knockdown on MCF-7 cells; B: MTT to detect the impact of circCNOT2 knockdown on MCF-7 cell proliferation; C: Flow cytometry to detect the impact of circCNOT2 knockdown on MCF-7 apoptosis; D: Transwell to detect the effect of knocking down circCNOT2 on the of MCF-7 cell invasion and migration; E: Western blot to detect the effect of knocking down circCNOT2 on E-cadherin, N-cadherin, Vimentin and snail protein expressions in MCF-7 cells. Values presentation was detailed in mean ± SD (n = 3). Via one-way ANOVA to calculate the significance of each group, the variance correction was done via Tukey’s test. *P < 0.05
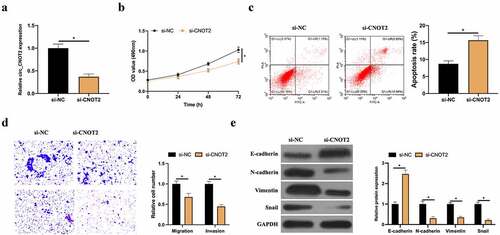
Figure 3. CircCNOT2 competitively binds to miR-409-3p. A: RT-qPCR to detect miR-409-3p expression in BC and adjacent normal tissues; B: RT-qPCR to detect miR-409-3p expression in MCF-10A, MCF-7 and SKBR-3; C: RT-qPCR to detect the influence of knocking down or overexpressing circCNOT2 on miR-409-3p expression; D: Via http://starbase.sysu.edu.cn/ to predict binding sites of circCNOT2 and miR- 409-3p; E-F: DLR and RNA-pull down experiments to detect the targeting relationship between circCNOT2 and miR-409-3p, respectively; G: Correlation analysis on circCNOT2 and miR-409-3p expressions in patients’ tissues. Values presentation was detailed in mean ± SD (n = 3). Via one-way ANOVA to calculate the significance of each group, the variance correction was done via Tukey’s test. *P < 0.05
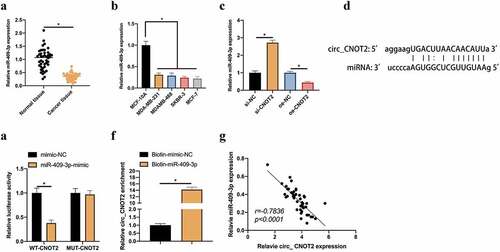
Figure 4. Overexpressed miR-409-3p inhibits BC invasion, migration and EMT. A: RT-qPCR to detect the impact of overexpressing miR-409-3p on MCF-7 cell; B: MTT method to detect the influence of overexpressing miR-409-3p on MCF-7 cell proliferation; C: Flow cytometry to detect the impact of overexpressing miR-409-3p on MCF-7 cell apoptosis; D: Transwell to detect the effect of overexpression of miR-409-3p on MCF-7 cell invasion and migration; E: Western blot to detect the impact of overexpressing miR-409-3p on E-cadherin, N-cadherin, Vimentin and snail protein expression in MCF-7 cells. Values presentation was detailed in mean ± SD (n = 3). Via one-way ANOVA to calculate the significance of each group, the variance correction was done via Tukey’s test. *P < 0.05
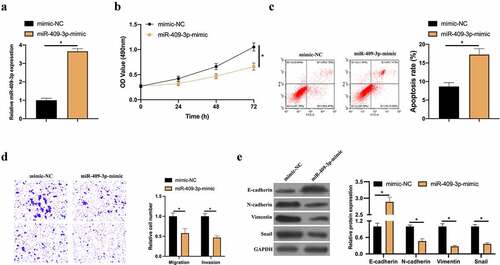
Figure 5. TWIST1 is a target gene of miR-409-3p. A: RT-qPCR to detect TWIST1 expression in BC tissue samples and adjacent normal tissues; B: RT-qPCR and western blot to detect TWIST1 expression in MCF-10A, MCF-7 and SKBR-3 C: RT-qPCR and western blot to detect how up-regulated miR-409-3p impacted TWIST1; D: Via http://starbase.sysu.edu.cn/ to predict the binding sites of TWIST1 and miR-409-3p; E-F: DLR and RNA-pull down experiments to detect the targeting relationship between TWIST1 and miR-409-3p, respectively; G: Correlation analysis on TWIST1 and miR-409-3p expressions. Values presentation was detailed in mean ± SD (n = 3). Via one-way ANOVA to calculate the significance of each group, the variance correction was done via Tukey’s test. *P < 0.05
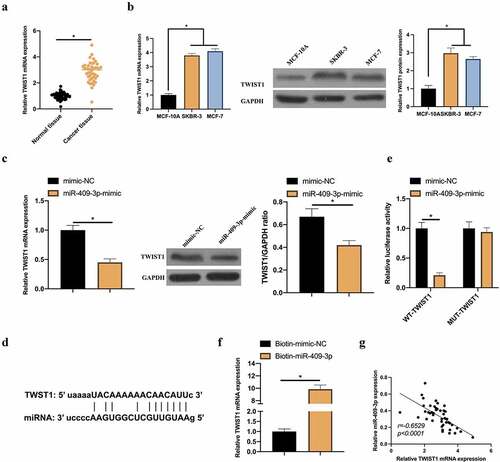
Figure 6. Up-regulated TWIST1 promotes BC cell invasion, migration and EMT. A: RT-qPCR and western blot to detect how up-regulated TWIST1 influenced MCF-7 cell; B: MTT method to detect how up-regulated TWIST1 impacted MCF-7 cell proliferation; C: Flow cytometry to detect the impact of up-regulated TWIST1 on MCF-7 cell apoptosis; D: Transwell to detect the influence of up-regulated TWIST1 on MCF-7 cell invasion and migration; E: Western blot to detect the impact of up-regulated TWIST1 on E-cadherin, N-cadherin, Vimentin and snail protein expression in MCF-7 cells. Values presentation was detailed in mean ± SD (n = 3). Via one-way ANOVA to calculate the significance of each group, the variance correction was done via Tukey’s test. *P < 0.05
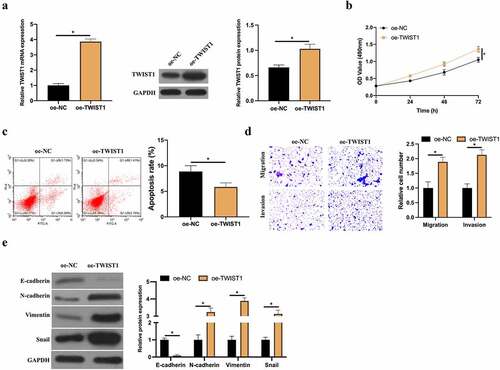
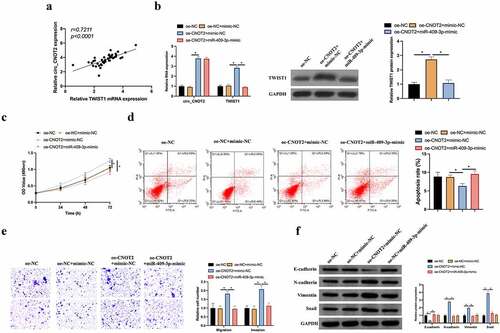
Figure 7. MiR-409-3p/TWIST1 axis is involved in the process of circCNOT2 regulating on BC. A: Correlation analysis on TWIST1 and circCNOT2 expressions in patients’ tissues; B: RT-qPCR and western blot to detect how co-transfection impacted circCNOT2 and TWIST1 expressions; C: MTT to detect the influence of co-transfection on MCF-7 cell proliferation; D: Flow cytometry to detect how co-transfection affected MCF-7 cell apoptosis; E: Transwell to detect the impact of co-transfection on MCF-7 cell invasion and migration; F: Western blot to detect how co-transfection impacted E-cadherin, N-cadherin, Vimentin and snail protein expression in MCF-7 cells. Values presentation was detailed in mean ± SD (n = 3). Via one-way ANOVA to calculate the significance of each group, the variance correction was done via Tukey’s test. *P < 0.05