Figures & data
Table 1. The sequences of the oligos or primers
Figure 1. Identification of NR_002794 downstream genes and signaling pathways through RNA-seq and bioinformatics analysis. (a) SWAN71 cells were transfected with sh-NR_002794#1, sh-NR_002794#2, or sh-NR_002794#3 knockdown plasmid or control plasmid. Forty-eight hours later, the NR_002794 level was measured by RT-qPCR assay. (b) Cluster analysis for differentially expressed genes in KD versus NC group and OE versus NC group. (c) Venn analysis (http://jvenn.toulouse.inra.fr/app/example.html) for differentially expressed genes in KD versus NC group or OE versus NC group. ***P < 0.001
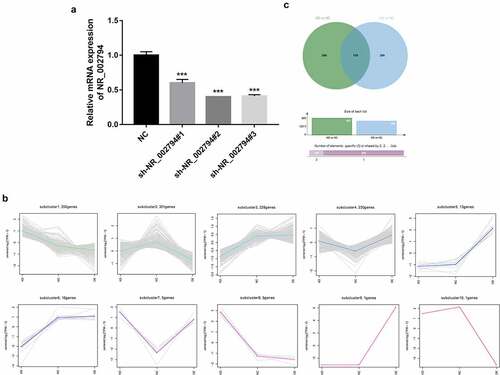
Figure 2. Effects of NR_002794 overexpression or knockdown on AKT, ERK1/2, and apoptotic pathways. SWAN71 cells were infected with lenti-NR_002794, sh-NR_002794, or control lentiviruses for 72 h. Next, protein levels of cleaved-caspase 3, Bcl2, p-ERK1/2, ERK1/2, p-AKT, and AKT were measured through western blot assay. ***P < 0.001
Figure 3. Effects of NR_002794 overexpression or knockdown on the expression of CCL4L2/IL15RA/IL32/TIE1/dkk1/DMD/GCNT1/Gypc/Hes1. SWAN71 cells were infected with lenti-NR_002794, sh-NR_002794, or control lentiviruses for 48 h. Next, the expression levels of CCL4L2/IL15RA/IL32/TIE1/dkk1/DMD/GCNT1/Gypc/Hes1 were measured by RT-qPCR assay. **P < 0.01. ***P < 0.001
Figure 4. NR_002794 suppressed cell proliferation and migration by silencing TIE1 in SWAN71 cells. (a-d) SWAN71 cells were infected with lenti-NR_002794, sh-NR_002794, lenti-TIE1, lenti-NR_002794+ lenti-TIE1, sh-NR_002794+ lenti-TIE1 or control lentiviruses. (a and b) At 48 h post-infection, cell proliferative ability was measured by CCK-8 (a) and BrdU (b) assays. (c and d) Cell migratory ability was examined through wound healing assay (c) and transwell migration assay (d). *: treated group versus NC group. #: treated group versus lenti-NR_002794 group. &: treated group versus sh-NR_002794 group. ***P < 0.001. ###P < 0.001. &&&P < 0.001
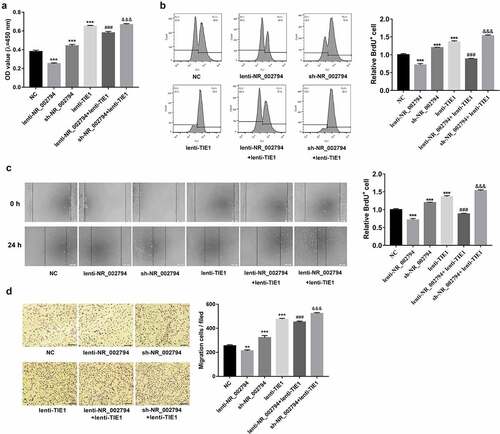
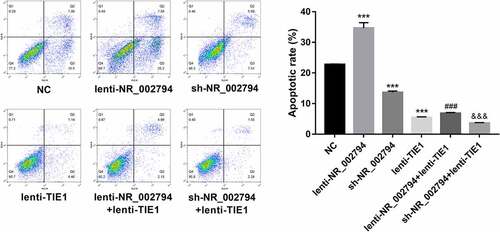
Figure 5. NR_002794 facilitated cell apoptosis through down-regulating TIE1 in SWAN71 cells. SWAN71 cells were infected with lenti-NR_002794, sh-NR_002794, lenti-TIE1, lenti-NR_002794+ lenti-TIE1, sh-NR_002794+ lenti-TIE1 or control lentiviruses. Cell apoptotic rate was measured through flow cytometry at 72 h post infection. *: treated group versus NC group. #: treated group versus lenti-NR_002794 group. &: treated group versus sh-NR_002794 group. ***P < 0.001. ###P < 0.001. &&&P < 0.001