Figures & data
Figure 1. Representative images of postoperative samples from a 68-year-old Chinese woman with an adenomyoepithelioma (AME). (a) An image of AME tissues. (b) A typical image of hematoxylin and eosin-stained postoperative tissues. Scale bar = 100 μm. (c) Immunohistochemistry assay for keratin and vimentin expressions. Scale bar = 100 μm
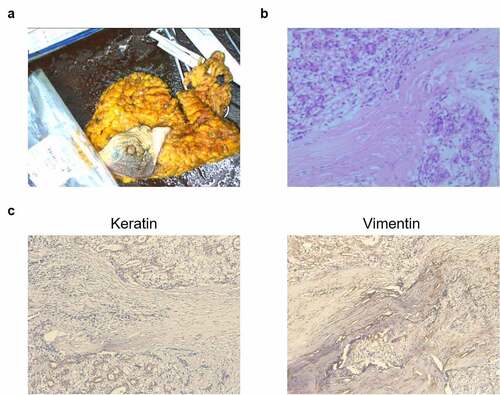
Figure 2. Images representing the process of culturing organoids from an adenomyoepithelioma (AME) of a patient. (a) The AME tumor sample was cut into 1-mm3 pieces and digested with 2 mg/mL collagenase. The tumor cells were then cultured under 2D and 3D culture systems. (b) The morphology of the cultured tumor cells and organoids at days 1, 3, and 7, as observed under a microscope. The diameter of the organoids was measured at days 1, 3, and 7. Data are presented as mean ± standard deviation. n = 3, *p < 0.05, ***p < 0.001
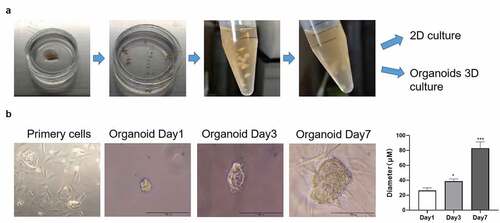
Figure 3. Short Tandem Repeat (STR) profiles of the adenomyoepithelioma (AME) organoids and the original AME tissue. The STR profiles revealed a 100% match between the two
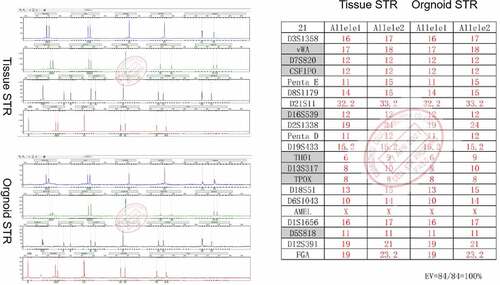
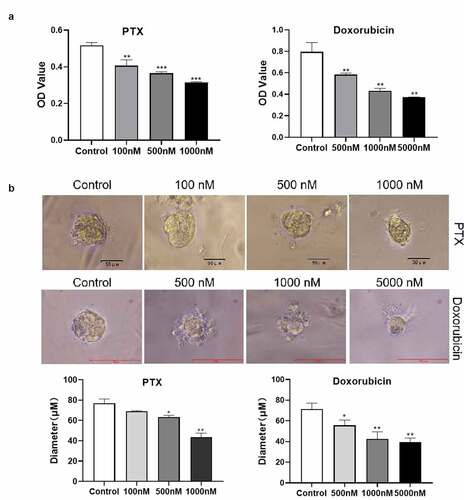
Figure 4. Sensitivity of primary adenomyoepithelioma (AME) tumor cells and AME organoids to chemotherapeutic drugs. (a) A representative image showing the viability of primary AME tumor cells, derived from an AME of the left breast of a Chinese woman, after paclitaxel and doxorubicin treatments, which was confirmed using Cell Counting Kit-8 assay. (b) A representative image of organoids treated with paclitaxel and doxorubicin. The diameter of organoids after paclitaxel treatment was measured. Data are presented as mean ± standard deviation. n = 3, *p < 0.05, **p < 0.01