
Figures & data
Table 1. Association of miR-451a and clinicopathological features in patients with NPC
Table 2. The sequence of PCR primers used in this study
Figure 1. The selection of miR-451a and CSE1L as our study objects in NPC. (a). The top 5 most downregulated miRNAs in NPC. Data obtained from GSE118613 analysis. Criteria: adjusted P < 0.05, logFC≤-1.5. (b). miR-451a expression in NPC tissues and non-cancerous tissues by RT-qPCR. (c). Venn diagram showing the intersection between the predicted target genes of miR-451a by starbase and the significantly upregulated genes from GSE12452 data analysis (adjusted P < 0.01, logFC≥1.5). (d). The expression of the five genes in GSE12452 data analysis. (e). CSE1L expression in NPC tissues and non-cancerous tissues by RT-qPCR
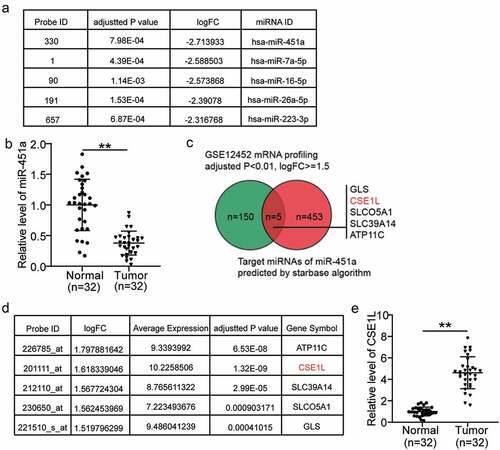
Figure 2. MiR-451a could inhibit the NPC cells proliferation. (a). mRNA levels of miR-451a in NP69, 6–10B, 5–8 F and SUNE-1 cells. **P < 0.001 vs.NP69. (b). The efficiency of transfected miR-451a mimic or negative control (NC) at 48 h was validated by RT-qPCR. (c). CCK8 assay revealing the suppression of miR-451a overexpression on the viability of 5–8 F and SUNE-1 cells. (d). BrdU assay demonstrated the inhibiting effect of miR-451a on the proliferation of 5–8 F and SUNE-1 cells. E. Flow cytometry assay showing the promoting effect of miR-451a on the apoptosis rate of 5–8 F and SUNE-1 cells. *P < 0.05, **P < 0.001 vs. blank
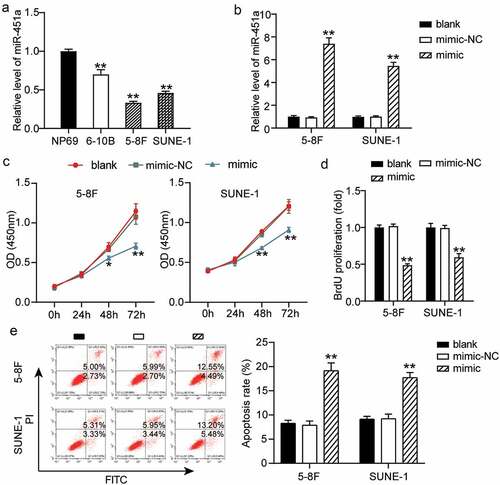
Figure 3. MiR-451a negatively regulates the migration, invasion and xenograft tumor growth of NPC cells. 5–8 F and SUNE-1 cells were transfected with miR-451a synthetic miRNA analogs. The migratory and invasive capacities of both cells were evaluated by the wound-healing assay (a) and transwell assay (b). (c) Representative images of tumors formed and the growth curves of tumor volume. (d) Tumor weight. *P < 0.05, **P < 0.001 vs. blank or mimic-NC
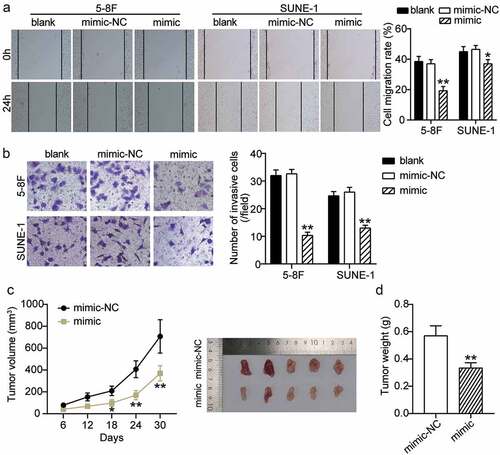
Figure 4. CSE1L is a direct target of miR-451a. (a). starBase analysis predicted that 3′UTR sequence of CSE1L contained the complementary sequence of miR-451a. (b). Luciferase activity of CSE1L with wild type (WT) or mutant (MUT) 3ʹUTR in 5–8 F and SUNE-1 cells. **P < 0.001 vs. miR-NC. (c). RNA pull-down assay was performed to analysis the interaction between CSE1L and miR-451a in 5–8 F and SUNE-1 cells transfected with miR-451a mimic and miRNA-NC. **P < 0.001 vs. Bio-NC. (d). The expression of miR-451a and CSE1L extracted by RIP assay was evaluated in samples bound to Ago2 or IgG. **P < 0.001 vs. IgG. E. Pearson assay showed a strong negative correlation (R2 = 0.7123) between miR-451a level and CSE1L expression in NPC tissues
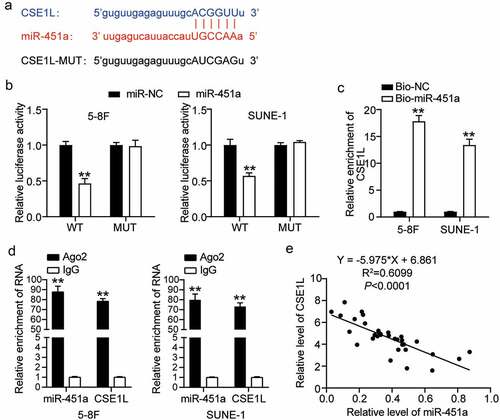
Figure 5. Ecotopic expression of CSE1L offsets the modulation of miR-451a on proliferation of NPC cells. (a). The expression of CSE1L in 5–8 F and SUNE-1 cells was detected by western blot. (b). CCK8 assay examining the viability of 5–8 F and SUNE-1 cells following transfection with pcDNA 3.1-CSE1L (OE), miR-451a mimic, OE-NC + mimic-NC, OE + mimic. (c). BrdU assay was performed to quantify the proliferation of 5–8 F and SUNE-1 cells following transfection with OE, miR-451a mimic, OE-NC + mimic-NC, OE, OE + mimic. (d). Flow cytometry assay was performed to quantify the apoptosis rate of 5–8 F and SUNE-1 cells following transfection with OE, miR-451a mimic, OE-NC + mimic-NC, OE + mimic. **P < 0.001 vs. blank; ##P < 0.001 vs. OE + mimic
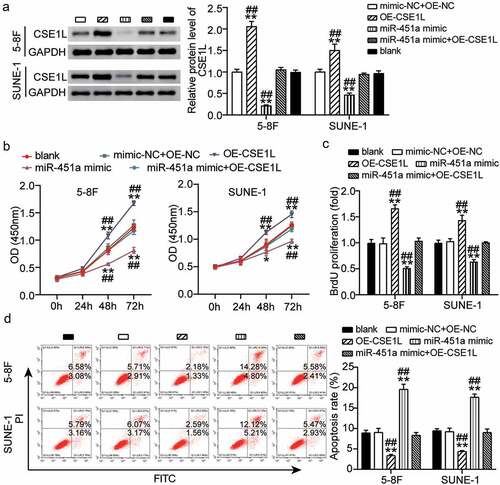
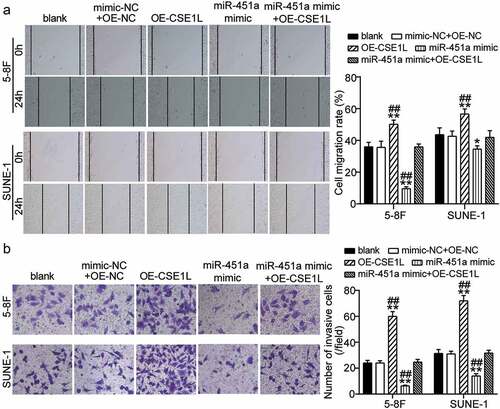
Figure 6. CSE1L overexpression restores the migration and invasion impairment of NPC cells induced miR-451a mimic. (a). In vitro wound healing analysis of NPC cells migration after transfected with pcDNA 3.1-CSE1L (OE), miR-451a mimic, OE-NC + mimic-NC, OE + mimic at 0 and 48 h. (b). In vitro transwell assay was performed to examine the invasion of NPC cells following transfection with OE, miR-451a mimic, OE-NC + mimic-NC, OE + mimic. **P < 0.001 vs. blank; ##P < 0.001 vs. OE + mimic
Supplemental Material
Download ()Availability of data and materials
The datasets used and analyzed during the current study are available from the corresponding author on reasonable request.