Figures & data
Figure 1. ARAP1-AS1 plays the key role in ccRCC. (a) The expression of ARAP1-AS1 in multiple cancers based on GEPIA analysis. (b) The expression of ARAP1-AS1 in ccRCC and normal samples based on GEPIA analysis. *, P < 0.01. (c) The expression of ARAP1-AS1 in ccRCC and non-tumor tissues from 16 patients diagnosed with ccRCC in our hospital. (d) The expression of ARAP1-AS1 in human normal renal tubular epithelial cell line (HK-2) and human ccRCC cell lines (Caki-1 and A498) by RT-qPCR. **, P < 0.001 compared with HK-2. (e) The transfection efficiency of siRNAs targeting to ARAP1-AS1 was identified by RT-qPCR. NC, negative control. si-lnc-1 and si-lnc-2 were two siRNAs of ARAP1-AS1. **, P < 0.01 compared with si-NC
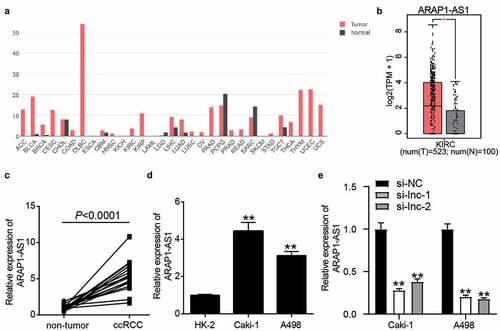
Figure 2. The negative effect of ARAP1-AS1 knockdown on ccRCC cells. (a) The cell proliferation was detected by CCK-8 assay in ccRCC cells with the transfection of si-ARAP1-AS1. (b) The colony formation ability was identified by colony formation assay in ccRCC cells with the transfection of si-ARAP1-AS1. (c) The cell apoptosis was measured by flow cytometry in ccRCC cells with the transfection of si-ARAP1-AS1. (d) The cell migration was verified by wound healing assay in ccRCC cells with the transfection of si-ARAP1-AS1. NC, negative control. si-lnc-1 and si-lnc-2 were two siRNAs of ARAP1-AS1. **, P < 0.01 compared with si-NC.+
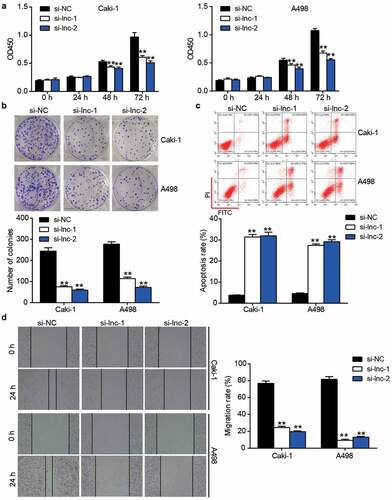
Figure 3. miR-361-3p/PGF might be the downstream of ARAP1-AS1 by bioinformatics analysis. (a) CCL5, IGFBP3, VEGFA and PGF were predicted to be related to cell proliferation by STRING analysis. (b) PGF and CCL5 were positive correlated with ARAP1-AS1 in ccRCC samples based on GEPIA analysis. (c) PGF with high expression showed the poor prognosis of ccRCC by GEPIA analysis. (d) Three miRNAs were overlapped from miRDB, TargetScan, and miRwalk. miRDB was used to predict miRNAs sponged by ARAP1-AS1. TargetScan and miRwalk were used to predict the miRNAs targeting PGF. (e) The miR-361-3p expression reduced in ccRCC samples
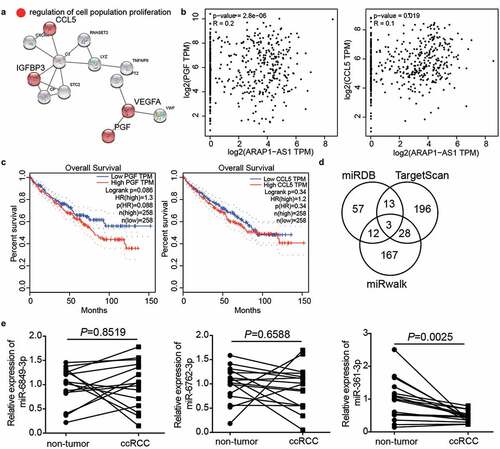
Figure 4. miR-361-3p could be sponged by ARAP1-AS1. (a) The binding sites were predicted by miRDB. (b) miR-361-3p mimic upregulated miR-361-3p expression in Caki-1 and A498 cells. NC, negative control. mimic, miR-361-3p mimic. **, P < 0.01 compared with mimic-NC. (c) Luciferase assay proved the targeting relationship between ARAP1-AS1 and miR-361-3p. WT, wild-type. MUT, mutant. NC, negative control. mimic, miR-361-3p mimic. **, P < 0.01. (d) miR-361-3p expression was negative related to ARAP1-AS1 expression in ccRCC tissues
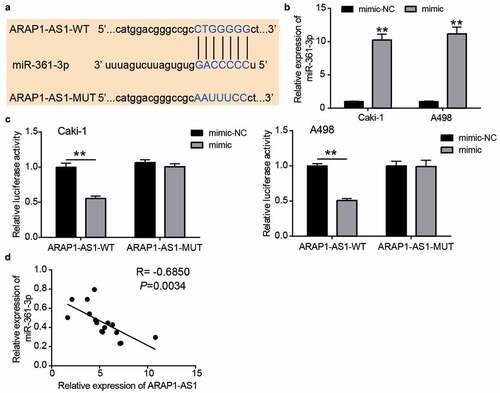
Figure 5. The negative effect of si-ARAP1-AS1 on ccRCC cells was relieved by miR-361-3p inhibitor. (a) The expression of ARAP1-AS1 and miR-361-3p in transfected ccRCC cells. (b) The cell proliferation was detected by CCK-8 assay in transfected ccRCC cells. (c) The colony formation ability was identified by colony formation assay in transfected ccRCC cells. (d) The cell apoptosis was measured by flow cytometry in transfected ccRCC cells. (e) The cell migration was verified by wound healing assay in transfected ccRCC cells. NC, negative control. si-lnc, siRNA of ARAP1-AS1. inhibitor, miR-361-3p inhibitor. *, P < 0.05 and **, P < 0.01 compared with si-NC. ##, P < 0.01 compared with si-lnc+inhibitor
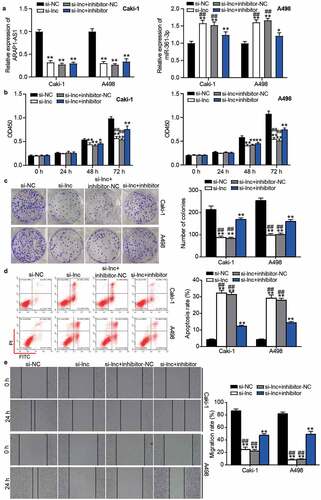
Figure 6. PGF was the target of miR-361-3p in ccRCC cells. (a) The binding sites were predicted by TargetScan. (b) Luciferase assay proved the targeting relationship between PGF and miR-361-3p. WT, wild-type. MUT, mutant. NC, negative control. mimic, miR-361-3p mimic. **, P < 0.01. (c) RNA pull-down assay confirmed the direct interaction between miR-361-3p and PGF. **, P < 0.01. Bio-NC, biotin-labeled negative control. Bio-mimic, biotin-labeled miR-361-3p mimic. (d) The PGF expression reduced in ccRCC tissues. (e) PGF expression was negative related to miR-361-3p expression in ccRCC tissues
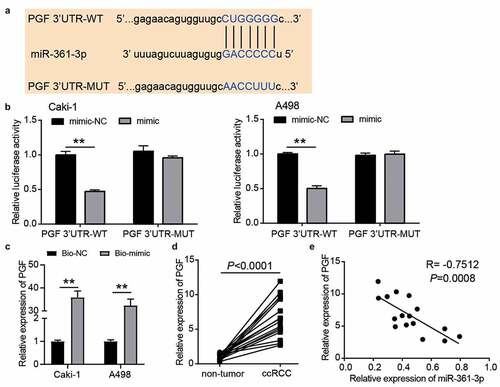
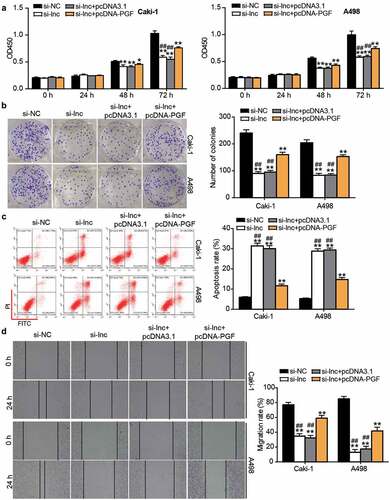
Figure 7. The negative effect of si-ARAP1-AS1 on ccRCC cells was relieved by PGF overexpression vectors. (a) The cell proliferation was detected by CCK-8 assay in transfected ccRCC cells. (b) The colony formation ability was identified by colony formation assay in transfected ccRCC cells. (c) The cell apoptosis was measured by flow cytometry in transfected ccRCC cells. (d) The cell migration was verified by wound healing assay in transfected ccRCC cells. NC, negative control. si-lnc, siRNA of ARAP1-AS1. pcDNA-PGF, PGF overexpression vectors. *, P < 0.05 and **, P < 0.01 compared with si-NC. ##, P < 0.01 compared with si-lnc+pcDNA-PGF