Figures & data
Figure 1. A Volcano plots showing DEGs in GSE73754 and b GSE94683 microarray datasets. c Heatmaps and hierarchical clustering analysis of the top 50 DEGs in GSE73754 and d GSE94683. e Genes with adjusted P-value < 0.05 and |log2 fold change (FC)| > 0.2 are identified as DEGs. Red indicates up-regulation and blue indicates down-regulation. Venn diagram depicting 355 overlapping DEGs identified between GSE73754 and GSE94683 datasets
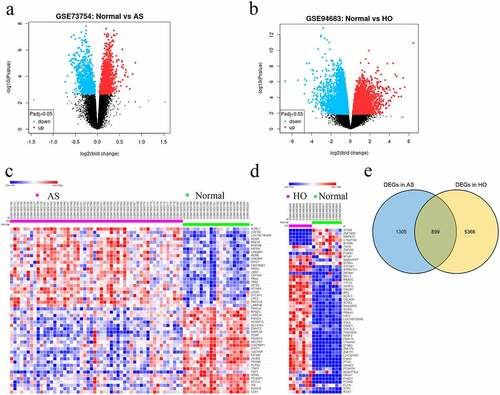
Figure 2. A Hierarchical clustering of 52 AS and 20 healthy samples. b Analysis of network topology for various soft-thresholding powers. Left: The x-axis reflects the soft-thresholding power; the y-axis reflects the scale independent topology model fit index. Right: The x-axis reflects the soft-thresholding power; the y-axis reflects the mean connectivity (degree). c Clustering dendrogram of genes with dissimilarity based on topological overlap, together with assigned their module colors. d Eigengene dendrogram and eigengene adjacency plot. e Module trait association. Each row corresponds to a module; each cell contains the corresponding correlation and P-value. The table is color-coded by correlation. f Scatter diagrams depicting gene correlation of the module. Left: salmon module; Right: red module. Comparison between the red and the salmon module indicated salmon to be the key module correlated with AS (cor = −0.36)
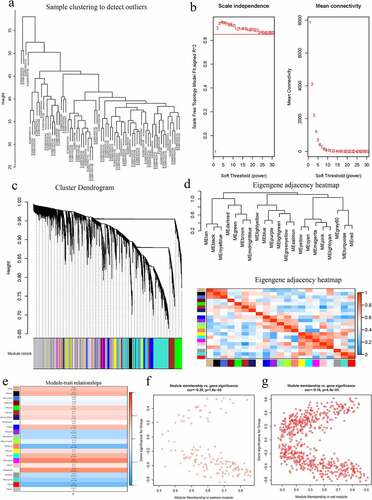
Figure 3. GO and KEGG pathway analysis of the salmon module. Node size reflects gene count, and the node color reflects P-value [-log10 (P-value)]. a Biological processes. b Cellular components. c Molecular functions of the DEGs. d KEGG pathway analysis
![Figure 3. GO and KEGG pathway analysis of the salmon module. Node size reflects gene count, and the node color reflects P-value [-log10 (P-value)]. a Biological processes. b Cellular components. c Molecular functions of the DEGs. d KEGG pathway analysis](/cms/asset/892dbb2c-bc2e-4b08-9762-89597921240b/kbie_a_1975981_f0003_oc.jpg)
Figure 4. A PPI network construction of the DEGs in the salmon module. The red arrows indicate the positions of the three hub genes. b Venn diagram depicting the three DEGs identified simultaneously in the GSE73754, and GSE94683 datasets and hub genes of AS
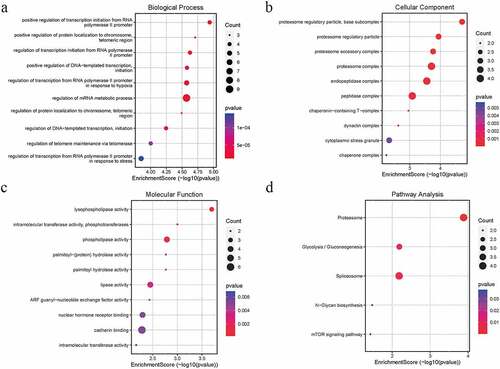
Table 1. Hub genes were screened in a salmon module. Hub genes were defined as having a module membership over 0.8 and a gene significance over 0.4
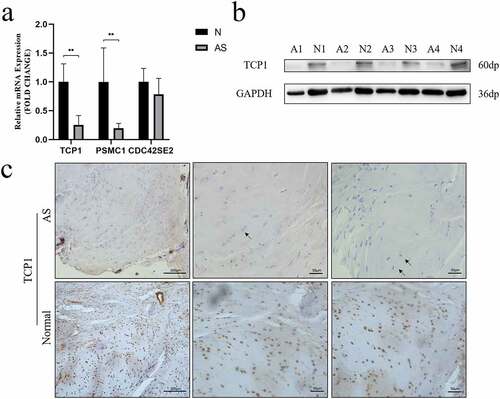
Figure 5. A TCP1 and PSMC1 mRNA expression were significantly decreased in AS patients. **P < 0.001. b TCP1 protein expression was analyzed using western blot. TCP1 protein levels in AS decreased compared to those in control. c Sections of interspinous ligament from AS patients and healthy controls were immunostained for TCP1 and counterstained with hematoxylin. The black arrows indicate fibrochondrocytes. Immunohistochemistry showed that TCP1 was expressed in the nucleus of fibrochondrocytes under normal conditions, but absent in AS patients