Figures & data
Figure 1. Workflow of this study
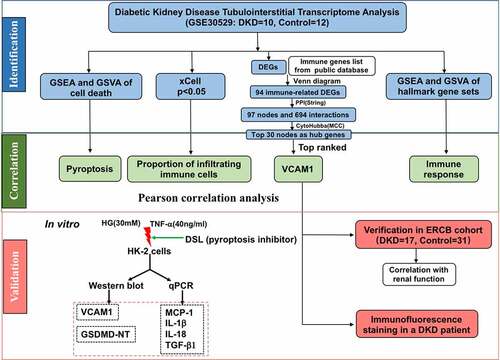
Table 1. Immune cell enrichment score between DKD patients and normal controls
Figure 2. Immune cell infiltration analysis by xCell in the tubulointerstitium of DKD. (a) Comparison of xCell scores of 64 cell types in the tubulointerstitium between DKD and control renal tissue in the GSE30529 dataset. (b) The cellular landscape of immune microenvironment in DKD. The heatmap represents cell type enrichment score of each immune cell type for all samples. DC, dendritic cell; Tcm, central memory T cell; Tem, effective memory T cell; Tγδ cell, gamma delta T cell
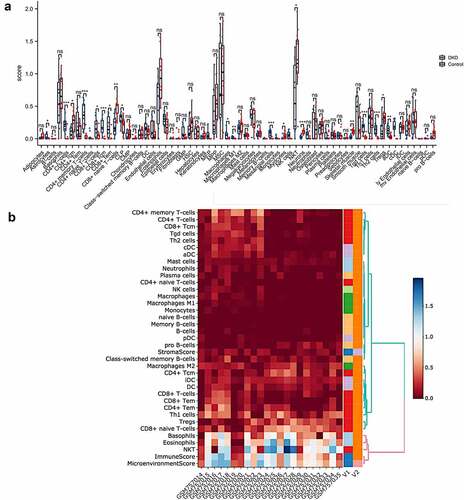
Table 2. Significantly enriched hallmark gene sets using GSEA
Figure 3. Gene set enrichment analyses (GSEA) and gene set variation analyses (GSVA). (a) Barplot of GSVA results of 50 hallmark gene sets. (b)-(d) GSEA results of ‘Hallmark_ interferon alpha response’, ‘Hallmark_ interferon gamma response’ and ‘Hallmak complement’. (e) GSEA result of pyroptosis
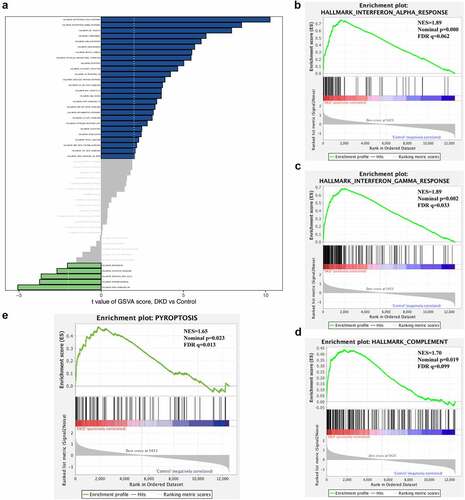
Figure 4. Correlation between immune cells and pyroptosis
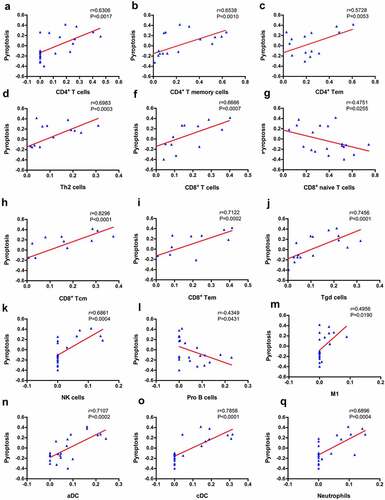
Table 3. Top 30 in network string_interactions.tsv ranked by MCC method
Figure 5. Differentially expressed genes. (a) Heatmap of potential differentially expressed genes in the tubulointerstitium between DKD and control renal tissue. (b) Volcano plot of potential differentially expressed genes in the tubulointerstitium between DKD and control renal tissue. The top ten differentially genes are shown
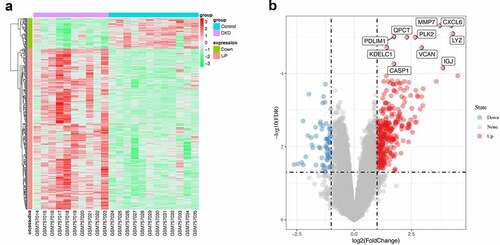
Figure 6. Identification of hub genes and enrichment analysis. (a) Venn diagram of DEGs and immune-related gene list. (b) Top thirty hub immune genes identified via PPI network. (c) Hallmark, KEGG and GO enrichment analysis of the top thirty hub immune genes. (d) Two most significant clusters of DEGs were identified by MCODE plugin
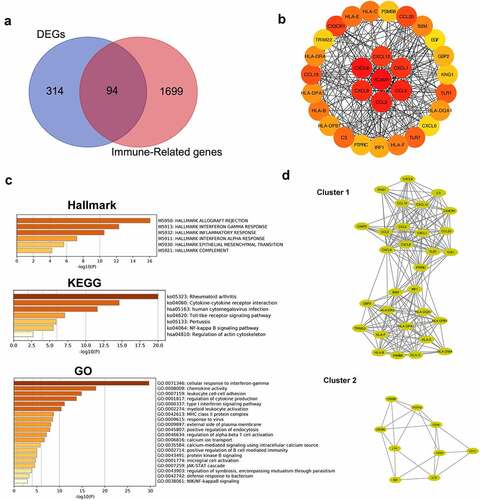
Figure 7. Correlation between VCAM1 and immune cells and pyroptosis. (a) VCAM1 expression was significantly increased in patients with DKD (n = 10) compared with healthy controls (n = 12) (***P < 0.001). (b) Correlation of VCAM1 with the infiltrated immune cells. (c) Correlation of VCAM1 with pyroptosis
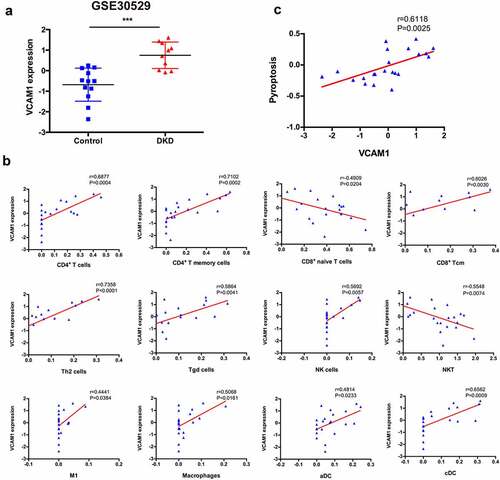
Figure 8. Verification, clinical relevance and immunofluorescence validation of VCAM1. (a) Verification of the increased VCAM1 expression in DKD in ERCB cohort (31 healthy controls and 17 DKD) (****P < 0.0001). (b) Correlation between VCAM1 expression and GFR in ERCB. (c) Correlation between VCAM1 expression and serum creatinine in ERCB. (d) Immunofluorescence staining of VCAM1 in normal kidney tissue and DKD. The tubular basements are outlined. Scale bars, 50 μm
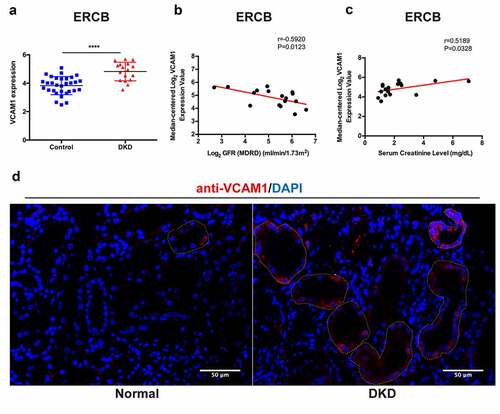
Figure 9. DSL inhibited HG-induced HK-2 cell pyroptosis, VCAM1 expression and inflammation. (a) Western blot detected the expression of GSDMD-NT and VCAM1. n = 4. (b) Quantitative reverse-transcription PCR of IL-1β, IL-18, MCP-1, TGF-β1 in HK-2 cells. n = 4. Data are means ± SEM. *P < 0.05, **P < 0.01, ***P < 0.001
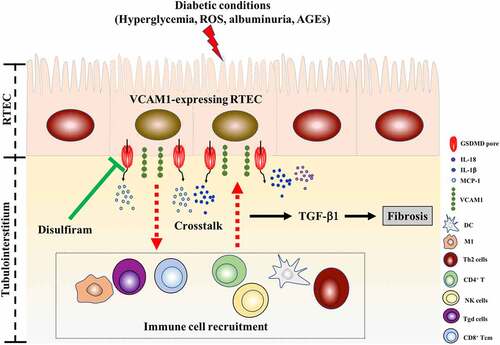
Figure 10. A proposed model of VCAM1-expressing tubular epithelial cell promoting interstitial inflammation and fibrosis in DKD, and their inhibition by disulfiram