
Figures & data
Table 1. Baseline characteristics of 90 patients
Figure 1. A:Chao1 curves of each sample; the estimated operational taxonomic unit richness basically approached saturation in all samples.B:The number of enterotype was calculated according to CH index. C: Jensen–Shannon-based principal coordinates analysis
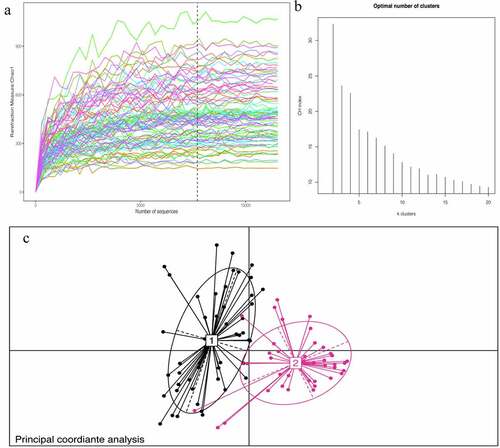
Figure 2. Taxonomic composition of the gut microbiome of patients. double pie chart (inner circle: phylum level, outer circle: genus level)
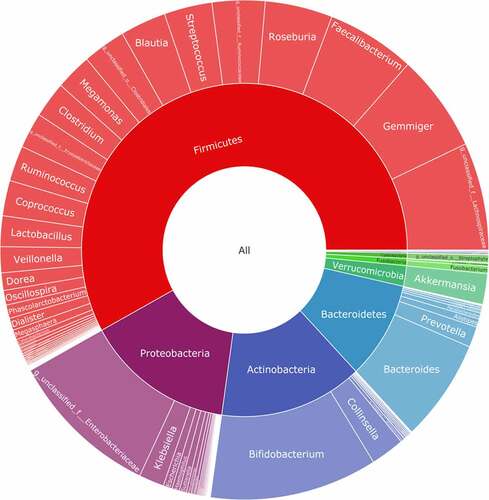
Table 2. Clinical characteristics of patients according to enterotype
Figure 3. Taxonomic composition of the gut microbiome according to the asymptomatic hyperuricemia and control groups. double pie chart (inner circle: phylum level, outer circle: genus level). A: the asymptomatic hyperuricemia groups; B:control groups
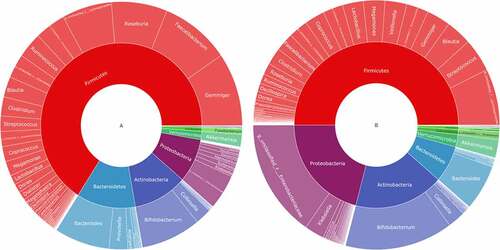
Figure 4. Comparison of fecal microbial diversity, as estimated by the Shannon index(a), Chao1 index(b), Ace index(c) and goods_coverage index(d). A: the asymptomatic hyperuricemia groups; B:control groups
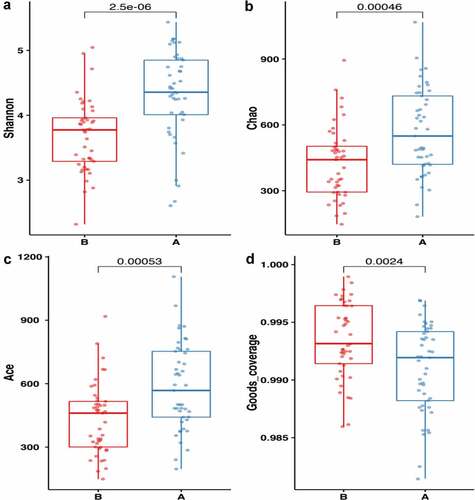
Figure 5. Differences in beta diversity indices between asymptomatic hyperuricemia and healthy groups measured with Adonis test and PCOA. The horizontal and vertical axes represent the first and second principal coordinates explaining the greatest proportion of variance to the bacterial communities (showed by percentage). A: the asymptomatic hyperuricemia groups; B:control groups; PCOA: principal coordinates analysis
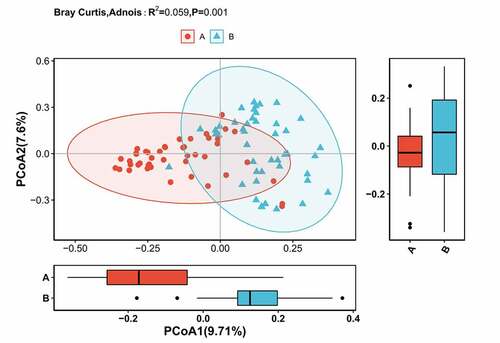
Figure 6. (a) clustering tree showing significant taxonomic differences in the gut microbiota between AH (negative score) and control (positive score) groups through LEfSe analysis (LDA scores (log10) >3). (b) Cladogram indicating the phylogenetic distribution of the gut microbiota in AH and control groups through LEfSe analysis (LDA scores (log10) >3). AH: asymptomatic hyperuricemia; p: phylum; c: class; o: order; f: family; g: genus; LEfSe: linear discriminant analysis effect size; LDA: linear discriminant analysis. #:Tentative names in greenenes database
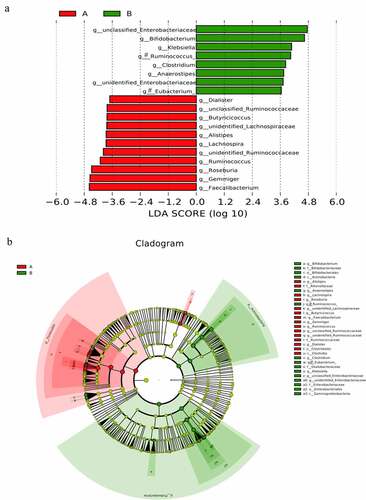
Figure 7. Important biomarkers.[A] The top 10 bacteria belong to the genus level.[B] ROCs curve with AUC for the diagnostic performance of the gut microbial model
![Figure 7. Important biomarkers.[A] The top 10 bacteria belong to the genus level.[B] ROCs curve with AUC for the diagnostic performance of the gut microbial model](/cms/asset/5572095a-14fc-4b64-a398-c1585bcf94d2/kbie_a_1976897_f0007_oc.jpg)