
Figures & data
Table 1. The relationship between miR-186-3p or IGF1 expression and clinicopathological characteristics in 50 patients with cervical cancer
Table 2. PCR primers used in this study
Figure 1. MiR-186-3p is downregulated and correlated with cell proliferation, invasion and apoptosis of cervical cancer. (a) MiR-186-3p expression by qRT-PCR in cervical cancer tissues and the adjacent normal tissues. **P < 0.001 vs. adjacent normal tissues. (b) MiR-186-3p expression by qRT-PCR in the human cervical surface epithelial cell line (HcerEpic) and four cervical cancer cell lines (HeLa, CaSki, SiHa, and C33A). **P < 0.001 vs. HcerEpic cell. (c) MiR-186-3p expression by qRT-PCR in the HeLa and SiHa cells transfected with miR-186-3p inhibitor or mimic. **P < 0.001 vs. vs. CON. (d, e) MTT (d) and BrdU incorporation (e) assays of cell viability after HeLa and SiHa cells transfected with miR-186-3p inhibitor or mimic. *P < 0.05; **P < 0.001 vs. CON. (f) Transwell assay in HeLa and SiHa cells transfected with miR-186-3p inhibitor or mimic. Left panel: representative images of the lower chamber (invading cells). Right panel: graph represents number of cell invasion. *P < 0.05; **P < 0.001 vs. CON. (g) Caspase-3 activity ELISA assay in HeLa and SiHa cells transfected with miR-186-3p inhibitor or miR-NC. **P < 0.001 vs. CON. MiR, microRNA; CON, control; NC, negative control
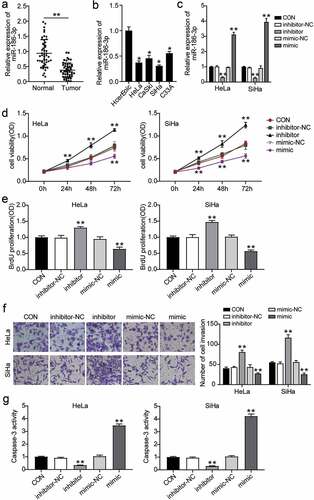
Figure 2. IGF1 is a direct target of miR-186-3p in cervical cancer cell. (a) IGF1 was predicted as miR-186-3p target. Top and bottom, predicted two miR-186-3p binding site in the 3′ UTR of IGF1. (b) Dual-luciferase reporter assay. NC RNA was set to 1.0 in each experiment, and the luciferase activity with miR-186-3p was normalized relative to NC RNA. *P < 0.05; **P < 0.001 vs. NC. (c) RNA-pull down assay. qRT-PCR of IGF1 expression in HeLa and SiHa cells transfected with Bio-NC and Bio-miR186-3p. **P < 0.001 vs. bio-NC. (d) Comparison of IGF1 expression in the cervical cancer tissues and the adjacent normal tissues. **P < 0.01 vs. adjacent normal tissues. (e) Pearson’s correlation analyses showing a negative correlation of miR-186-3p and IGF1 mRNA levels in cervical cancer tissues. (f) qRT-PCR of IGF1 in HcerEpic, HeLa and SiHa cells. **P < 0.001 vs. HcerEpic cells. IGF1, insulin-like growth factor 1; 3ʹUTR, 3ʹuntranslated region; miR, microRNA; NC, negative control; WT, wild-type; MUT, mutant-type; bio-NC, biotinylated- negative control oligo
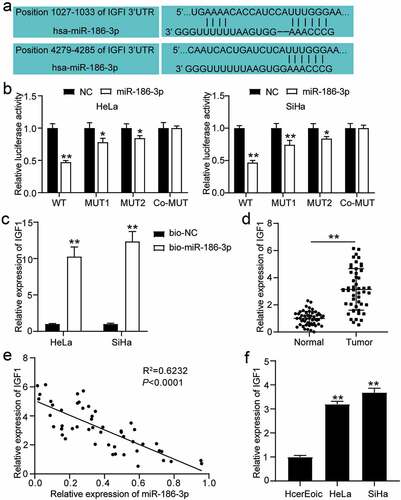
Figure 3. IGF1 mediates the functional effects of miR-186-3p on cervical cancer cell. (a) qRT-PCR of MiR-186-3p (left panel) and IGF1 (right panel) expression in HeLa and SiHa cells transfected with si-IGF1 or miR-186-3p inhibitor. (b) western blot analyses of IGF1 expression in miR-186-3p inhibitor- or si-IGF1-transfected HeLa and SiHa cells. (c, d) MTT (c) and BrdU incorporation (d) assays of cell viability after HeLa and SiHa cells transfected with si-IGF1 or miR-186-3p inhibitor. (e) Transwell assay in HeLa and SiHa cells transfected with si-IGF1 or miR-186-3p inhibitor. Left panel: representative images of the lower chamber (invading cells). Right panel: graph represents number of cell invasion. (f) Caspase-3 activity ELISA assay in HeLa and SiHa cells transfected with si-IGF1 or miR-186-3p inhibitor. *P < 0.05; **P < 0.001 vs. CON. #P < 0.05; ##P < 0.001 vs. si+inhibitor. CON, control; NC, negative control; si-, small interfering RNA; IGF1, insulin-like growth factor 1; miR-, microRNA
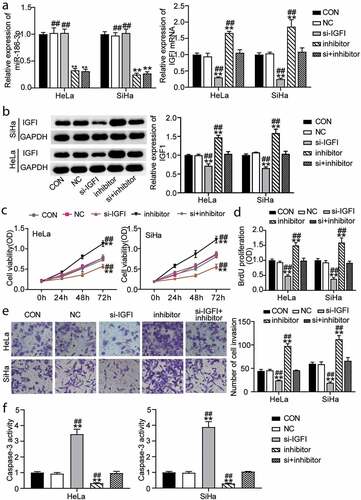
Figure 4. MiR-186-3p suppress PI3K/Akt pathway through downregulating IGF1 expression. (a, b) western blot analyses of PI3K, P-AKT and T-AKT expression in miR-186-3p inhibitor- or si-IGF1-transfected HeLa (a) and SiHa (b) cells. *P < 0.05; **P < 0.001 vs. CON. #P < 0.05; ##P < 0.001 vs. si+inhibitor. (c) MTT assays of cell viability after HeLa and SiHa cells pretreated by PI3K signaling inhibitor (LY294002) following transfection with miR-186-3p inhibitor. *P < 0.05; **P < 0.001 vs. CON. #P < 0.05; ##P < 0.001 vs. LY294002+ inhibitor. P-AKT, phosphorylated-AKT. T-AKT, total-AKT; CON, control; NC, negative control; si-, small interfering RNA; IGF1, insulin-like growth factor 1
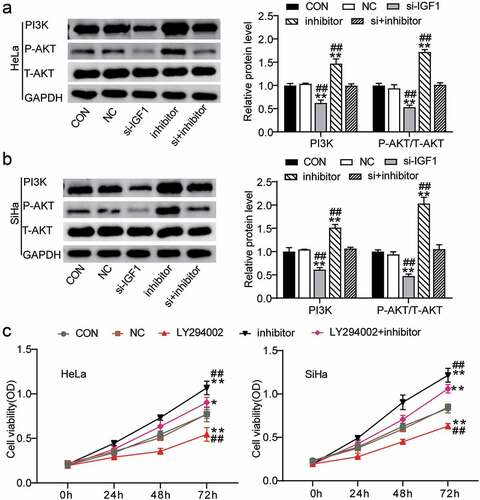
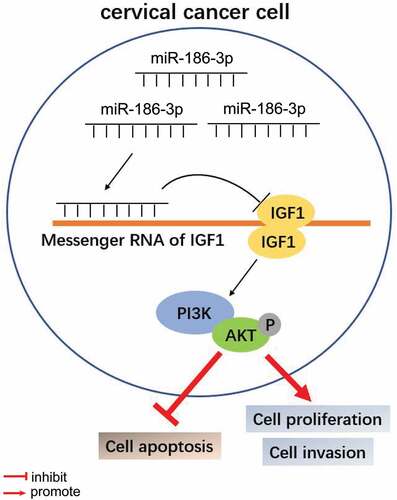
Figure 5. Model explaining the antitumor effect of miR-186-3p in cervical cancer
Availability of data and materials
The datasets used and/or analyzed during the current study are available from the corresponding author on reasonable request.