
Figures & data
Figure 1. lncRNA CASC9 might play the key role in OSCC by miR-545-3p/LAMC2. (a) The expression of lncRNA CASC9 in multiple cancer types based on GEPIA database. Red color represents the CASC9 expression in tumor samples, and green color represents the CASC9 expression in normal samples. (b) The 130 upregulated genes in OSCC samples from a mRNA microarray GSE37991 was identified by limma 3.26.8 with the filter criteria of adj.P < 0.05 and log2FC>2. (c) Three key genes were identified to be associated with cell migration and cell proliferation by STRING GO enrichment. (d) miR-545-3p was confirmed as the common miRNA targeting LAMC2 and lncRNA CASC9 by the prediction of TargetScan and starBase
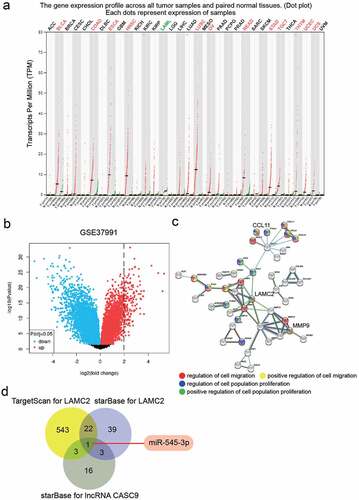
Figure 2. The effect of si-CASC9 in OSCC cells. (a) The expression of lncRNA CASC9 in OSCC tissues and paired adjacent tissues from 32 OSCC patients. The data were analyzed by with paired student’s t-test. (b) The expression of lncRNA CASC9 in OSCC cells (SCC-4, CAL-27 and SCC-9) and human oral epithelial cells (HOEC). **P < 0.01 compared with HOEC using one-way ANOVA. (c) The expression of lncRNA CASC9 in SCC-4 and SCC-9 cells with the transfection of si-CASC9 was identified by RT-qPCR. (d) The cell proliferation in SCC-4 and SCC-9 cells with the transfection of si-CASC9 was detected by CCK8 assay. (e) The colony formation in SCC-4 and SCC-9 cells with the transfection of si-CASC9 was measured by colony formation assay. (f) The cell migration in SCC-4 and SCC-9 cells with the transfection of si-CASC9 was assessed by transwell assay. (c-f) **P < 0.01 compared with si-NC using two-way ANOVA. si-NC, siRNA negative control. si-lnc-1 and si-lnc-2, two siRNAs for CASC9
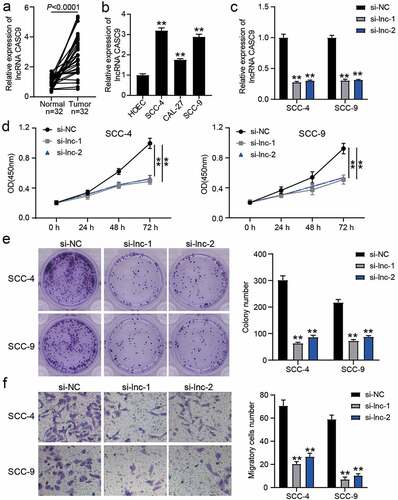
Figure 3. miR-545-3p was the downstream of lncRNA CASC9. (a) The binding sites between lncRNA CASC9 and miR-545-3p by starBase prediction. (b) The expression of miR-545-3p in SCC-4 and SCC-9 cells with the transfection of miR-545-3p mimic was confirmed by RT-qPCR. **P < 0.01 compared with mimic-NC using two-way ANOVA. (c) The luciferase activity was detected by luciferase assay in SCC-4 and SCC-9 cells with the co-transfection of CASC9-WT/CASC9-MUT and miR-545-3p mimic/mimic-NC. **P < 0.01 using two-way ANOVA. (d) The expression of miR-545-3p in OSCC tissues and paired adjacent tissues from 32 OSCC patients. The data were analyzed by paired student’s t-test. (e) The correlation between miR-545-3p and lncRNA CASC9 in OSCC tissues was analyzed by Pearson’s correlation analysis. (f) The enrichment of lncRNA CASC9 in miR-545-3p mimic group or mimic-NC group was detected by RIP assay. **P < 0.01 using two-way ANOVA. (g) The expression of lncRNA CASC9 and miR-545-3p in SCC-4 and SCC-9 cells with the transfection of si-CASC9 and/or miR-545-3p inhibitor. **P < 0.01 compared with si-NC. ##P < 0.01 compared with si-lnc+inhibitor-NC. The data were analyzed by two-way ANOVA. WT, wild-type. MUT, mutant. mimic, miR-545-3p mimic. si-NC, siRNA negative control. si-lnc, si-CASC9. inhibitor-NC, inhibitor negative control. inhibitor, miR-545-3p inhibitor
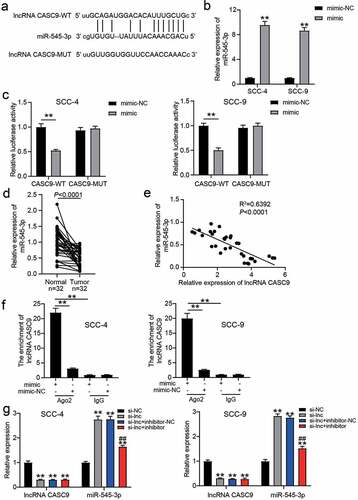
Figure 4. miR-545-3p inhibitor affect the function of si-CASC9 in OSCC cells. (a) The cell proliferation in SCC-4 and SCC-9 cells with the transfection of si-CASC9 and/or miR-545-3p was detected by CCK8 assay. (b) The colony formation in SCC-4 and SCC-9 cells with the transfection of si-CASC9 and/or miR-545-3p inhibitor was measured by colony formation assay. (c) The cell migration in SCC-4 and SCC-9 cells with the transfection of si-CASC9 and/or miR-545-3p inhibitor was assessed by transwell assay. **P < 0.01 compared with si-NC. ##P < 0.01 compared with si-lnc+inhibitor-NC. The data were analyzed by two-way ANOVA. si-NC, siRNA negative control. si-lnc, si-CASC9. inhibitor-NC, inhibitor negative control. inhibitor, miR-545-3p inhibitor
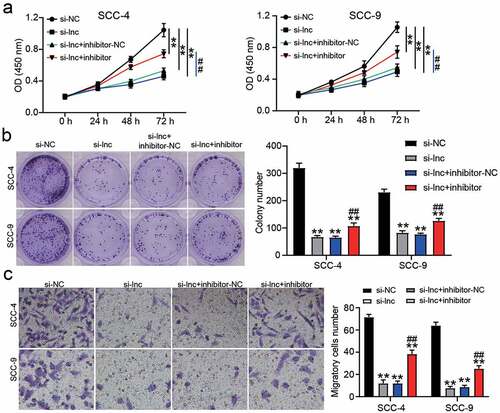
Figure 5. LAMC2 was the target of miR-545-3p. (a) The binding sites between LAMC2 and miR-545-3p by starBase prediction. (b) The luciferase activity was detected by luciferase assay in SCC-4 and SCC-9 cells with the co-transfection of LAMC2-WT/LAMC2-MUT and miR-545-3p mimic/mimic-NC. **P < 0.01 using two-way ANOVA. (c) The expression of LAMC2 in OSCC tissues and paired adjacent tissues from 32 OSCC patients. The data were analyzed by paired student’s t-test. (d). The correlation between miR-545-3p and LAMC2 in OSCC tissues was analyzed by Pearson’s correlation analysis. WT, wild-type. MUT, mutant. mimic, miR-545-3p mimic
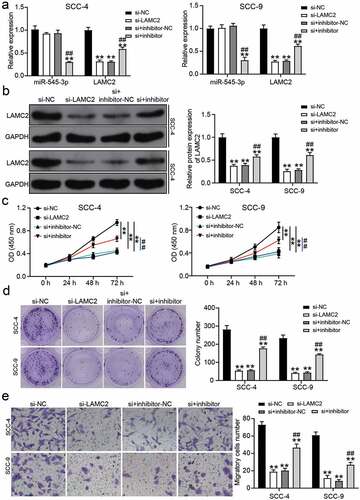
Figure 6. miR-545-3p inhibitor affect the function of si-LAMC2 in OSCC cells. (a) The expression of miR-545-3p and LAMC2 in SCC-4 and SCC-9 cells with the transfection of si-LAMC2 and/or miR-545-3p inhibitor was detected by RT-qPCR. (b) he expression of miR-545-3p and LAMC2 in SCC-4 and SCC-9 cells with the transfection of si-LAMC2 and/or miR-545-3p inhibitor was detected by western blotting. (c) The cell proliferation in SCC-4 and SCC-9 cells with the transfection of si-LAMC2 and/or miR-545-3p was detected by CCK8 assay. (d) The colony formation in SCC-4 and SCC-9 cells with the transfection of si-LAMC2 and/or miR-545-3p inhibitor was measured by colony formation assay. (e) The cell migration in SCC-4 and SCC-9 cells with the transfection of si-LAMC2 and/or miR-545-3p inhibitor was assessed by transwell assay. *P < 0.05, **P < 0.01 compared with si-NC. ##P < 0.01 compared with si-lnc+inhibitor-NC. The data were analyzed by two-way ANOVA. si-NC, siRNA negative control. inhibitor-NC, inhibitor negative control. inhibitor, miR-545-3p inhibitor
Supplemental Material
Download ()Availability of data and materials
All data generated or analyzed during this study are included in this published article.