Figures & data
Table 1. Correlation analysis between HOXD-AS2 expression and the clinical pathological parameters of GBM
Figure 1. LncRNA HOXD-AS2 expression is significantly up-regulated in GBM tissues and cell lines
(A) According to the TCGA (Cancer Genome Atlas) and GTEx (Genotype-Tissue Expression) database, a total number of 156 tumor samples and 5 adjacent normal samples were included for lncRNAs expression analysis. HOXD-AS2 was remarkably upregulated in tumor tissues. (B) Through GEPIA database (GBM sample (n = 163) and normal tissue (n = 207)), HOXD-AS2 was also significantly increased in tumor tissues than normal tissues. (C) qRT-PCR showed that the expression of HOXD-AS2 in GBM tumor tissues was significantly upregulated than in adjacent normal tissue. (D) The expression of HOXD-AS2 in U87, A172, and LN229 cell lines of GBM was significantly higher than in normal human astrocytes (NHAs). (E) Kaplan‐Meier (KM) plotter analysis showed that patients with high expression of HOXD-AS2 were associated with poorer prognosis. The above data in C-D are the summary of the measurements of 3 independent experiments (mean ± standard deviation). *, P < 0.05, and **, P < 0.01.
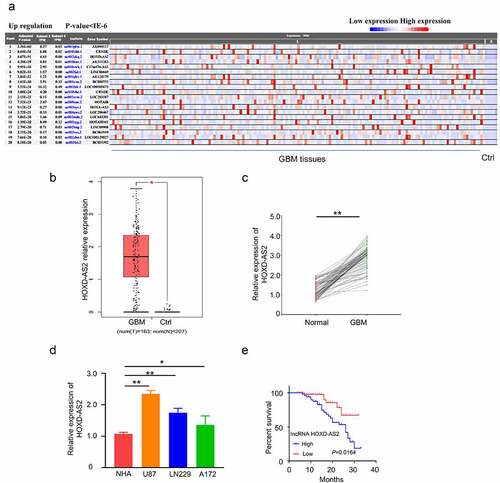
Figure 2. Knockdown of HOXD-AS2 inhibits GBM cell proliferation, migration and invasion, and promotes cell apoptosis
(A) U87 and LN229 cells with high expression of HOXD-AS2 were used to perform si-HOXD-AS2 knockdown experiment. The qRT-PCR result demonstrated that si-HOXD-AS2 significantly reduced HOXD-AS2 expression. (B) CCK-8 cell proliferation assay indicated that HOXD-AS2 silencing significantly decreased cell proliferation. (C) Wound-healing assay showed that HOXD-AS2 silencing significantly decreased the migration ability. (D) Transwell invasion assay showed that the HOXD-AS2 silencing impaired the invasion ability. (E) FACS analysis of Annexin V and PI staining showed that HOXD-AS2 silencing promotes apoptosis. The above data are the summary of the measurements of 3 independent experiments (mean ± standard deviation). **, P < 0.01, and ***, P < 0.001.
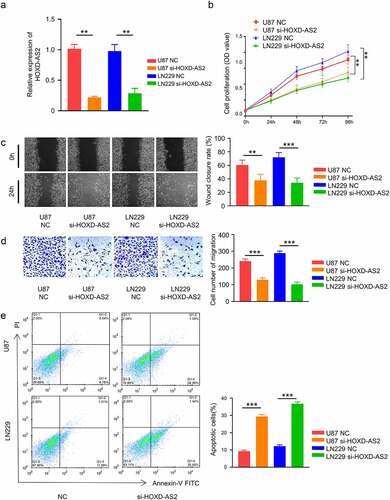
Figure 3. HOXD-AS2 acts as a sponge for miR-3681-5p
(A) By the analysis in Starbase 2.0 database (http://starbase.sysu.edu.cn/), miR-3681-5p shows a potential binding sites in HOXD-AS2 3’ UTR region. (B) The expression level of miR-3681-5p in GBM cells lines of U87 and LN229, as well as NHAs were detected by qRT-PCR. (C) The results of dual luciferase reporter assay in U87 cells showed that miR-3681-5p mimic inhibited luciferase activity in the wild type (WT) reporter containing miR-3681-5p potential binding sites in HOXD-AS2 3’ UTR region, but not in the reporter with mutated sequence (MUT). (D) The expression level of HOXD-AS2 in U87 and LN229 cells in the presence of miR-3681-5p mimic or inhibitor was detected by qRT-PCR. (E) The expression of miR-3681-5p in 92 GBM cancer tissues and adjacent normal tissues was detected by qRT-PCR. (F) Spearman correlation showed that there was a significant negative correlation between the expression of HOXD-AS2 and miR-3681-5p in GBM tumor tissues. The above data are the summary of the measurements of 3 independent experiments (mean ± standard deviation). **, P < 0.01, and ***, P < 0.001.
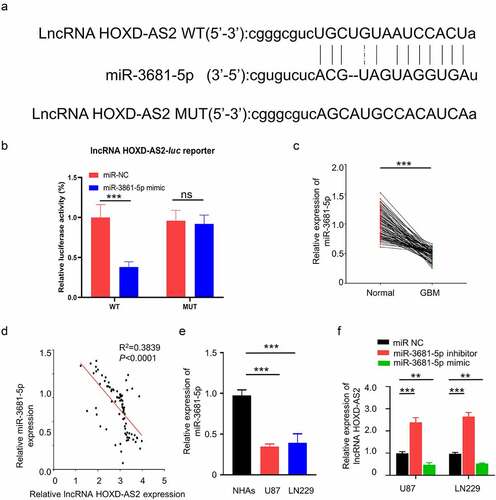
Figure 4. HOXD-AS2 maintains MALT1 expression via sponging miR-3681-5p
(A) Through miRTarBase (http://mirtarbase.mbc.nctu.edu.tw/php/index.php), there was a binding site of miR-3681-5p in noncoding region of MALT1 3’ UTR. (B) Luciferase reporter assay in U87 cells showed that miR-3681-5p mimic inhibited while miR-3681-5p inhibitor promoted luciferase activity in wild type reporter containing MALT1 3’ UTR. (C) The expression of MALT1 in GBM cell lines of U87 and LN229, as well as NHAs were detected by qRT-PCR. (D) Compared with NC, miR-3681-5p mimic down-regulated the expression of MALT1, whereas miR-3681-5p inhibitor up-regulated the expression of MALT1. (E) Western blotting showed that miR-3681-5p mimic down-regulated the protein level of MALT1, whereas miR-3681-5p inhibitor up-regulated MALT1. (F) There was a significant positive correlation between MALT1 and the expression of lncRNA HOXD-AS2, and a significant negative correlation between MALT1 and the expression of miR-3681-5p in tumor tissues. The above data are the summary of the measurements of 3 independent experiments (mean ± standard deviation). **, P < 0.01, and ***, P < 0.001.
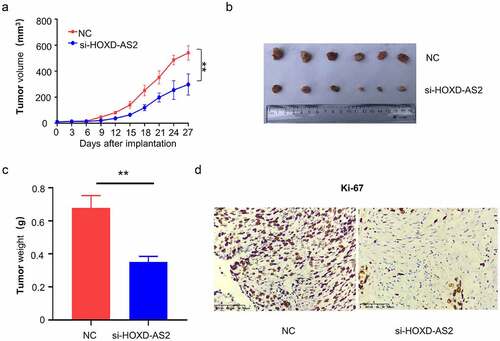
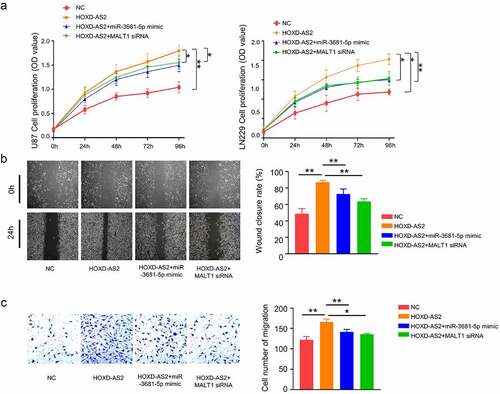
Figure 5. miR-3681-5p mimic or MALT1 knockdown attenuates aggressiveness in GBM cells
Cells were transfected with HOXD-AS2 expression vector, HOXD-AS2 vector +miR-3681-5p mimic or HOXD-AS2 vector +MALT1 siRNA. (A) CCK-8 assay indicated that the overexpression of HOXD-AS2 promoted the cell proliferation in U87 and LN229 cells, which was attenuated by miR-3681-5p mimic or MALT1 knockdown. (B) Wound-healing assay showed that that the overexpression of HOXD-AS2 significantly promoted the migration ability of cells, which was attenuated by miR-3681-5p mimic or MALT1 knockdown. (C) Transwell invasion assay showed that that the overexpression of HOXD-AS2 significantly promoted the invasion ability, which was attenuated by miR-3681-5p mimic or MALT1 knockdown. The above data are the summary of the measurements of 3 independent experiments (mean ± standard deviation). *, P < 0.05, and **, P < 0.01.
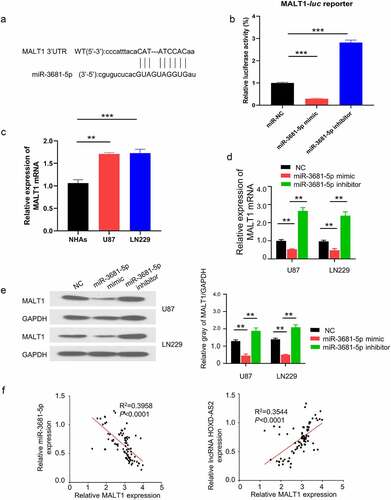
Figure 6. Downregulation of lncRNA HOXD-AS2 inhibits GBM tumor growth
(A) A total number of 12 nude mice were randomly assigned into two groups: NC group (n = 6, injected with U87 cells infected with siRNA control NC) and si-HOXD-AS2 group (n = 6, injected with U87 cells infected with siRNA for HOXD-AS2). Tumor volume was monitored every three days for 4 weeks. On day 28, mice were sacrifice and tumor in each mouse was dissected (B), and the tumor weight was recorded in each group (C). (D) Immunohistochemical staining of Ki-67 showed decreased number of Ki-67 cells in tumors from si-HOXD-AS2 group. Bar represents 100 μm. **, P < 0.01.