
Figures & data
Figure 1. Expression of YEATS2 in HNSCC tissues and OSCC cell lines. (a) Expression of YEATS2 in HNSC tissues (Data cited from GEPIA and Ualcan website). (b) Expression of YEATS2 in HNSCC based on individual cancer stages. (c) Expression of YEATS2 in HNSC based on individual cancer grade (Data cited from Ualcan website). (d) Expression of YEATS2 in obtained clinical HNSCC samples. Data were represented as mean ± SD and analyzed by paired t test (n = 17). *p < 0.05 vs. Control tissue group. (e) Expression of YEATS2 in HIOEC, FaDu, Detroit562, UPCI-SCC-090 and CAL-27 cells. Data were represented as mean ± SD at least three independent experiments and analyzed by one-way analysis of variance (ANOVA) followed by Tukey’s multiple comparison test. *p < 0.05 vs. HIOEC cell group. (f) Western blot was used to detect YEATS2 siRNA transfection efficiency in Detroit562 and FaDu cells. Data were represented as mean ± SD at least three independent experiments and analyzed by one-way analysis of variance (ANOVA) followed by Tukey’s multiple comparison test. *p < 0.05 vs. the control group
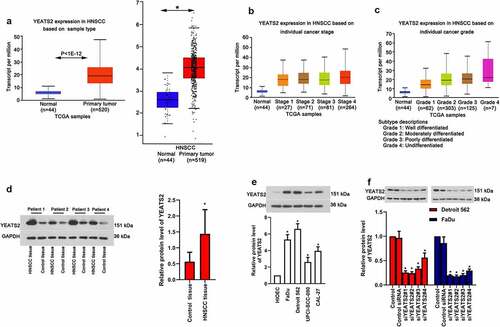
Figure 2. YEATS2 silence inhibited proliferation in Detroit562 and FaDu cells. (a) Cell viability was detected by CCK8 assay in Detroit562 and FaDu cells after YEATS2 siRNA transfection. (b) Proliferate ability was detected by EdU staining in Detroit562 and FaDu cells after YEATS2 siRNA transfection (at 400 × magnification). (c) Quantitative analysis for EdU staining. Data were represented as mean ± SD at least three independent experiments and analyzed by one-way analysis of variance (ANOVA) followed by Tukey’s multiple comparison test. *p < 0.05 vs. the control siRNA group
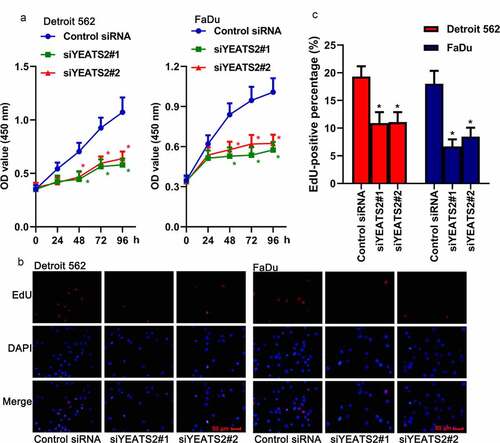
Figure 3. YEATS2 silence promoted apoptosis in Detroit562 and FaDu cells. Apoptosis was respectively detected by (a) TUNEL staining (at 400 × magnification) and (b) flow cytometry in Detroit562 and FaDu cells after YEATS2 siRNA transfection. (c) Western blot was used to analyze apoptosis-related protein cleaved caspase-3, cleaved PARP and PCNA expression in Detroit562 and FaDu cells after YEATS2 siRNA transfection. Data were represented as mean ± SD at least three independent experiments and analyzed by one-way analysis of variance (ANOVA) followed by Tukey’s multiple comparison test. *p < 0.05 vs. the control siRNA group
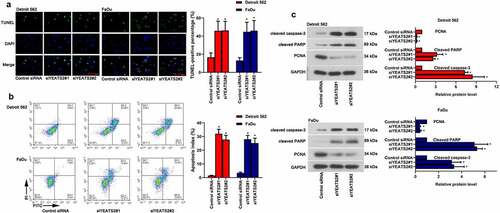
Figure 4. YEATS2 silence diminished migration and invasion ability in Detroit562 and FaDu cells. (a) Wound healing assay was conducted to detect the migration ability in Detroit562 and FaDu cells after YEATS2 siRNA transfection (at 100 × magnification). (b) Transwell assay was conducted to detect the invasion ability in Detroit562 and FaDu cells after YEATS2 siRNA transfection (at 200 × magnification). (c) Western blot was used to analyze active MMP-2 and active MMP-9 expression in Detroit562 and FaDu cells after YEATS2 siRNA transfection. Data were represented as mean ± SD at least three independent experiments and analyzed by one-way analysis of variance (ANOVA) followed by Tukey’s multiple comparison test. *p < 0.05 vs. the control siRNA group
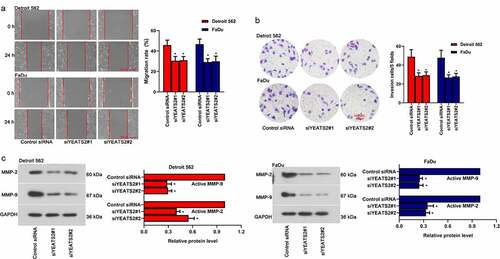
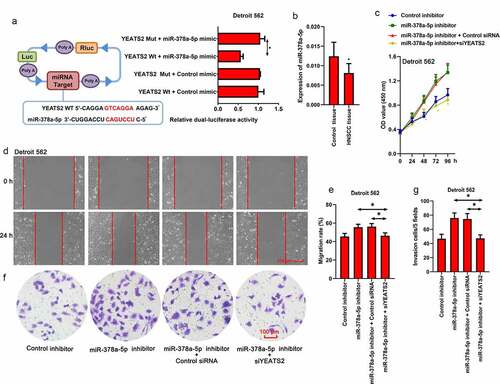
Figure 5. miR-378a-5p regulated migration and invasion ability via YEATS2 in Detroit562 cells. (a) Dual-Luciferase reporter assay was performed to detect the binding between miR-378a-5p and YEATS2 3ʹ-UTR in Detroit562 cells. (b) Expression of miR-378a-5p in obtained clinical HNSCC samples. Data were represented as mean ± SD and analyzed by paired t test (n = 17). *p < 0.05 vs. Control tissue group. (c) Cell viability was detected by CCK8 assay in Detroit562 cells after miR-378a-5p inhibitor and YEATS2 siRNA co-transfection. (d) and (e) Wound healing assay was conducted to detect the migration ability in Detroit562 cells after miR-378a-5p inhibitor and YEATS2 siRNA co-transfection (at 100 × magnification). (f) and (g) Transwell assay was conducted to detect the invasion ability in Detroit562 cells after miR-378a-5p inhibitor and YEATS2 siRNA co-transfection (at 200 × magnification). Data were represented as mean ± SD at least three independent experiments and analyzed by one-way analysis of variance (ANOVA) followed by Tukey’s multiple comparison test. *p < 0.05 vs. the indicated group
Data availability
Some or all data, models, or code that support the findings of this study are available from the corresponding author upon reasonable request.