
Figures & data
Table 1. The primer sequences
Figure 1. CASC9 significantly up-regulated within BC cells and tissues
(A) CASC9 level in 42 BC tissues relative to non-carcinoma samples. (B) CASC9 expression level within BC cells (MDA-MB-468, MCF-7, MDA-MB-231) and MCF-10A cells. **P< 0.01.
Figure 2. Knock-down of CASC9 inhibits BC cell growth but promotes their apoptosis
(A) CASC9 levels within MDA-MB-231 and MCF7 cells subjected to si-CASC9- or si-NC transfection were analyzed via qRT-PCR. (B) CCK-8 assay analysis of cell proliferation abilities in MCF-7 cells subjected to si-CASC9 or si-NC transfection. (C) CCK-8 assay was conducted for detecting MDA-MB-231 cell proliferation subjected to si-CASC9 or si-NC transfection. (D) Flow cytometry analysis of cell apoptosis abilities of MCF-7 and MDA-MB-231 cells subjected to si-CASC9- or si-NC transfection. *P< 0.05, **P< 0.01.
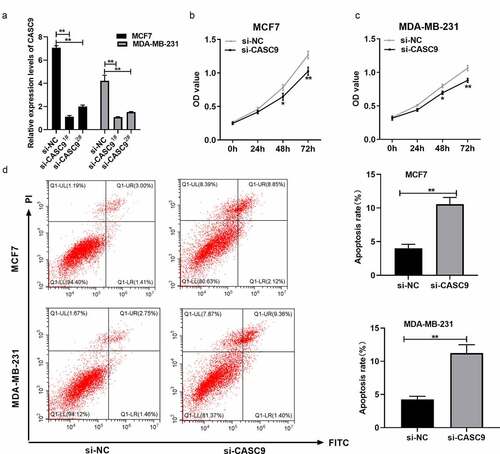
Figure 3. Knock-down of CASC9 suppresses breast cancer cell invasion and migration
(A) Transwell assays analysis of MDA-MB-231 and MCF-7 cell migration after si-CASC9- or si-NC transfection. (B) Transwell assays analysis on the invasion of the above two cell lines after si-CASC9- or si-NC transfection. **P< 0.01.
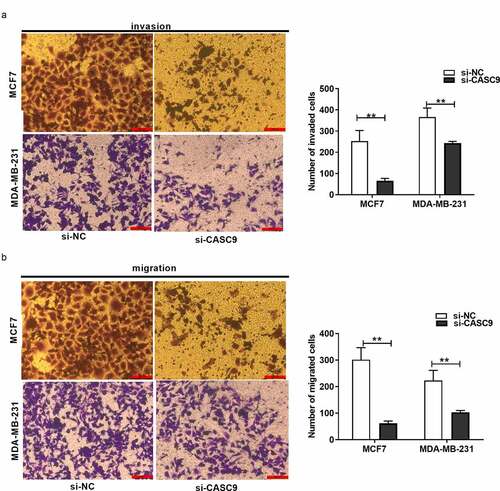
Figure 4. miR-590-3p as a CASC9 candidate target
(A) miR-590-3p binding sites for CASC9. (B) CASC9 mut or WT luciferase reporter plasmid was co-transfected in MCF-7 cells with miR-590-3p mimics or corresponding NC for luciferase assays. (C) CASC9 mut or WT luciferase reporter plasmid was co-transfected into MDA-MB-231 cells with miR-590-3p mimics or corresponding NC for luciferase assays. (D) miR-590-3p levels in MDA-MB-231 and MCF-7 cell lines subjected to si-CASC9 or si-NC transfection. (E) miR-590-3p levels within 42 BC tissue samples relative to matched non-carcinoma samples. (F) Correlation of CASC9 levels with miR-590-3p levels within BC tissues. (G) miR-590-3p levels within normal breat epithelial MCF-10A cells and BC cells (MDA-MB-231, MDA-MB-468, MCF7). **P< 0.01.
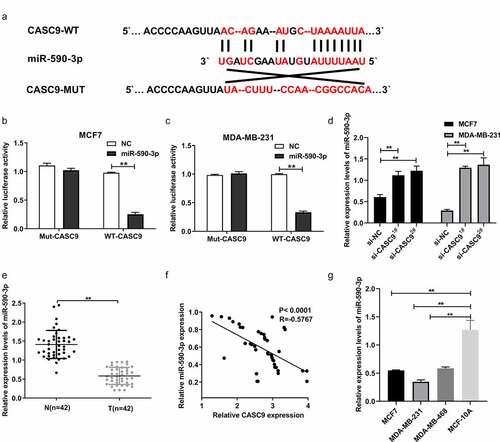
Figure 5. CASC9 promotes malignant behavior of BC cells through reducing miR-590-3p
(A) miR-590-3p levels within MDA-MB-231 and MCF7 cells subjected to miR-590-3p mimics or mimics-NC transfection were measured via qRT-PCR assay. (B) MCF-6 cell proliferation subjected to miR-590-3p mimics (or NC) and/or si-CASC9 (or si-NC) transfection detected via CCK-8 assay. (C) MDA-MB-231 cell proliferation subjected to miR-590-3p mimics (or NC) and/or si-CASC9 (or si-NC) transfection measured by CCK-8 assay. (D) Transwell assays of MDA-MB-231 and MCF7 cell migration following miR-590-3p mimics (or NC) and/or si-CASC9 (or si-NC) transfection. (E) Transwell assays analysis of cell invaded abilities within MDA-MB-231 and MCF7 cells subjected to miR-590-3p mimics (or NC) and/or si-CASC9 (or si-NC) transfection. (F) Flow cytometry analysis of cell apoptosis abilities within the above two cell lines following miR-590-3p mimics (or NC) and/or si-CASC9 (or si-NC) transfection. **P< 0.01.
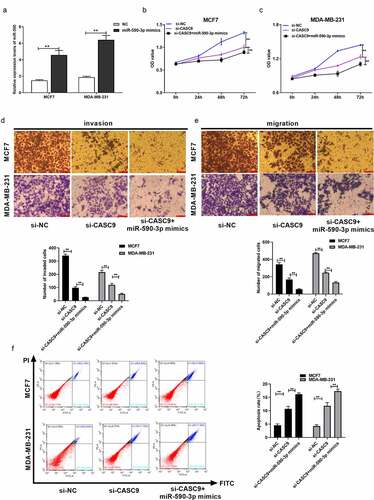
Figure 6. SIX1, a direct miR-590-3p target within BC cells
(A) SIX1 binding sites in miR-590-3p. (B) SIX1 mut or WT luciferase reporter plasmid was co-transfected in MCF-7 cells with miR-590-3p mimics or corresponding NC for luciferase assays. (C) SIX1 mut or WT luciferase reporter plasmid was co-transfected into MDA-MB-231 cells with miR-590-3p mimics or corresponding NC for luciferase assays. (D) SIX1 levels within MCF-7 and MDA-MB-231 cells after NC or miR-590-3p mimics transfection. (E) The expression level of SIX1 in BC tumor samples and normal samples predicted by GEPIA website. (F) SIX1 expression within 42 BC samples relative to matched non-carcinoma samples. (G) Correlation of SIX1 level with miR-590-3p level within BC tissues. (H) The correlation analysis between SIX1 expression and CASC9 level within BC samples. **P< 0.01.
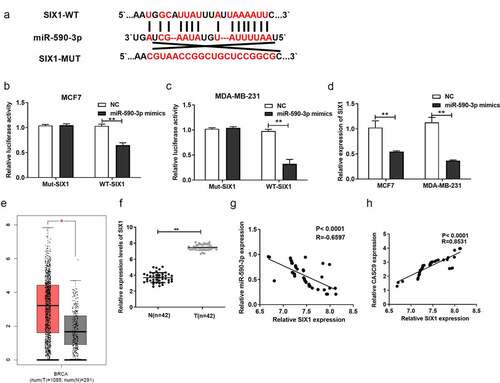
Figure 7. CASC9 promotes malignant behavior of BC cells by down-regulating miR-590-3p and up-regulating SIX1
(A) SIX1 levels within pcDNA3.1-SIX1- or pcDNA3.1-transfected MDA-MB-231 and MCF7 cell lines measured through qRT-PCR. (B) SIX1 levels within MDA-MB-231 and MCF7 cells following si-SIX1 or si-NC transfection measured by qRT-PCR. (C) Transwell assays analysis of migration abilities within the above two cell lines. (D) Transwell assays analysis of invaded abilities within the above two cell lines. (E) Viability of MCF7 cells measured through CCK-8 assay. (F) Viability of MDA-MB-231 cells detected through CCK-8 assay. (G) MDA-MB-231 and MCF7 cell apoptosis examined through flow cytometry. **P< 0.01.
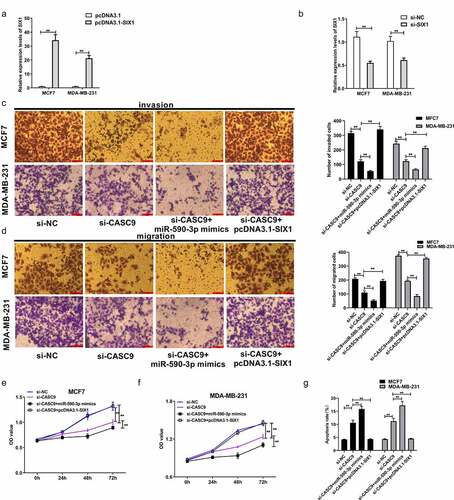
Figure 8. CASC9/miR-590-3p/SIX1/NF-κB pathway related to BC progression
(A) Protein levels within MCF7 cells detected through WB assay. (B) Protein levels within MDA-MB-231 cells detected through WB assay. All bars stand for mean ± SD for 3 individual assays. *P< 0.05, **P< 0.01.
Data availability statement
The data used to support the findings of this study are available from the corresponding author upon request.