Figures & data
Table 1. Primer sequences for RT-qPCR
Figure 1. Downregulation of miR-130a-3p expression in colorectal cancer tissue and cell lines, and the linkage between miR-130a-3p and colon carcinoma. (a, b) miR-130a-3p expression in CRC samples and normal tissue from the TCGA database. (c, d) miR-130a-3p expression in CRC tissue samples versus adjacent noncancerous tissue. (e) Comparison of miR-130a-3p expression among multiple CRC cell lines and a noncancerous colon epithelial cell line. Expression levels in (c–e) were estimated by RT-qPCR. (f) Kaplan-Meier survival curves are used to evaluate the prognostic value of miR-130a-3p in CRC. (g) miR-130a-3p has significantly associated with tumorigenesis of CRC. CRC, colorectal cancer. *P < 0.05, ** P < 0.01
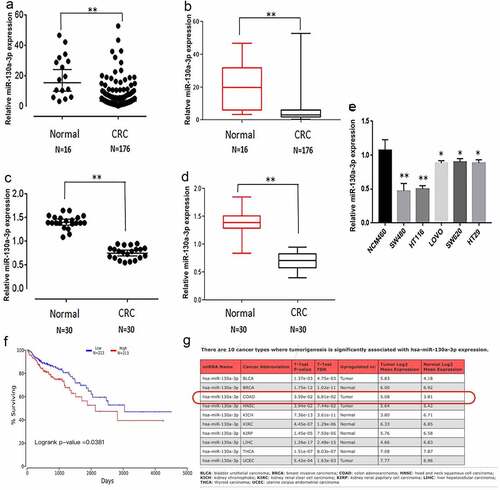
Figure 2. MiR-130a-3p overexpression inhibits CRC cell proliferation. (a, b) The miR-130a-3p level was increased in miR-120a-3p transfected SW480 and HCT116 cells. (c, d) CCK-8 assay for examining CRC cell viability. (e, f) Results of CRC cell colony formation assay. CRC, colorectal cancer. **P < 0.01
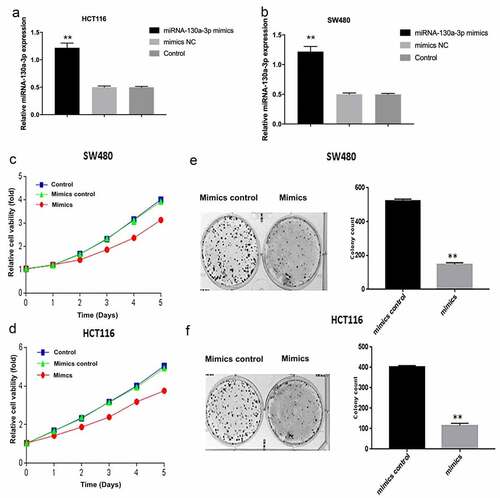
Figure 3. WNT1 is a direct target gene of miR-130a-3p. (a) RT-qPCR was used to detect the WNT1 mRNA expression in human CRC tissues and normal colon tissues. (b, c) Quantitation of WNT1 protein by western blot in untreated CRC cells (Control) and CRC cells with transfection of mimics control or miR-130a-3p mimics. (d, e) RT-qPCR for determining expression of WNT1 mRNA in SW480 and HCT116 cell. WNT1 expression was reduced at both protein and mRNA levels by miR-130a-3p overexpression. (f) Sequence diagrams of wild-type WNT1 3ʹ-UTR, corresponding mutant WNT1 3ʹ-UTR, and miR-130a-3p showing putative complementary binding sites. (g) Reporter assay showing that only wild-type WNT1 3ʹ-UTR suppressed luciferase activity. CRC, colorectal cancer. *P < 0.05 and **P < 0.01 vs controls
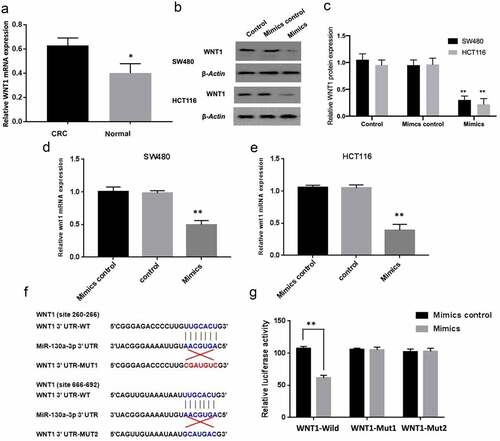
Figure 4. Downregulation of cyclin D1 and c-myc by miR-130a-3p overexpression. (a-b) RT-qPCR was performed to measure the mRNA expression of cyclin D1 and c-myc in human CRC tissues and normal colon tissues. (c-f) Western blotting for determining Cyclin D1 and c-myc protein expression in control, mimic control, and mimic transfection CRC cell groups. (g-j) RT-qPCR results. Reduction of cyclin D1 and c-myc in CRC cell lines by miR-130a-3p overexpression (mimics group), compared with control and mimics control groups. CRC, colorectal cancer. *P < 0.05, **P < 0.01
Figure 5. WNT1 overexpression reduces the suppressive effect of miR-130a-3p on c-myc and cyclin D1 expression. (a–f) CRC cells were co-transfected with a lentivirus WNT1 overexpression vector and miR-130a-3p mimic or mimic control. RT-qPCR and Western blot revealed that enhanced WNT1 expression attenuates the downregulation of c-myc and cyclin D1 induced by miR-130a-3p. (g) Results of CRC cell colony formation assay. **P < 0.01 vs. miR-mimics + pHAGE group. a. miR-mimics; b. miR-mimics+pHAGE; c. miR-mimics + pHAGE-wnt1. CRC, colorectal cancer
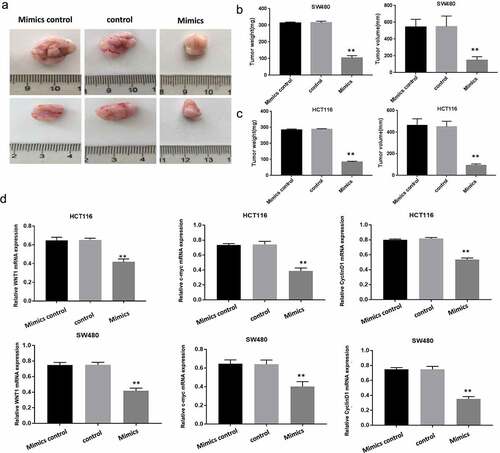
Figure 6. Overexpressed miR-130a-3p inhibits colorectal cancer cell growth in a mouse xenograft model. (a-c) The total weights and volumes of tumors derived from the indicated CRC cell line were decreased by miR-130a-3p overexpression (mimics group) compared with control CRC cell lines. (d) RT-qPCR results showed WNT1, Cyclin D1 and c-myc mRNA expression was downregulated in mimics group, compared with control and mimics control groups. **P < 0.01. Per group n = 6