Figures & data
Table 1. The time point of index detection and the number of animals
Table 2. Primer sequences of RT-qPCR
Figure 1. Identification of BMSC-EV. (a) Morphological observation of BMSCs under the microscope (100×); (b) The osteogenic, lipogenic, and chondrogenic differentiation characteristics of BMSCs were identified using Alizarin red, oil red O, and Alcian blue staining respectively; (c) flow cytometry detected BMSCs surface markers CD90, CD105, and CD34, CD45 expression; (d) Transmission electron microscopy of EV morphology; (e) qNano system for the detection of the size distribution of EVs; (f) Western blot analysis of expression of the EV positive markers CD63, CD81, CD9 and the negative marker Calnexin, using the supernatant of BMSC medium after GW4869 intervention as a control. The experiment was repeated three times independently
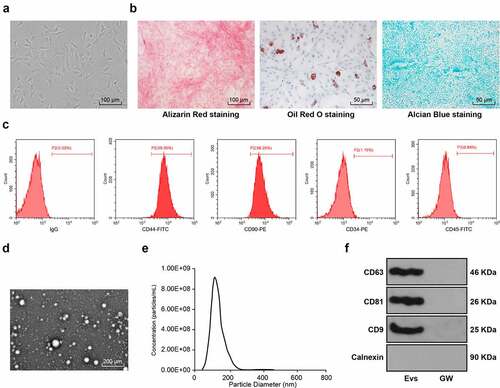
Figure 2. BMSC-EVs improve motor dysfunction and tissue damage of hindlimbs in SCI rats. (a) Motor recovery of hindlimbs of SCI rats assessed by BBB scoring at before modeling and days 1, 3, 7, 14, 21, and 28 after modeling (N = 24/12); (b) Nissl staining analysis of nerve cell injury in SCI rat spinal cord tissues on days 7 and 28 after modeling (200×); (c) HE staining analysis of SCI rat spinal cord histopathological changes on days 7 and 28 after modeling (200×); (d) RT-qPCR for expression of miR-23b in injured spinal cord tissue. n = 6. Data are expressed as mean ± standard deviation and analyzed using one-way ANOVA, with post hoc tests using Tukey’s multiple comparisons test, *p < 0.05, **p < 0.01, ##p < 0.01 (** indicates SCI group vs. sham group, ## indicates SCI+EVs group vs. SCI group)
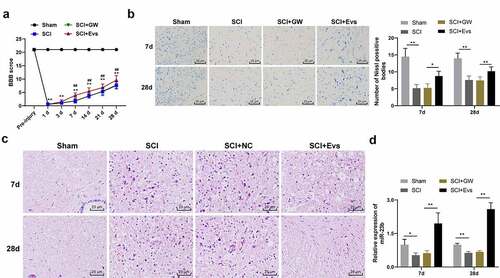
Figure 3. EV-miR-23b improves motor dysfunction and tissue damage of hindlimbs in SCI rats. (a) RT-qPCR analysis of the expression of miR-23b in BMSCs and EVs, and the expression of miR-23b in the spinal cord tissues of each group of rats on day 7 after modeling; (b) Motor recovery of hindlimbs of SCI rats assessed by BBB scoring at before modeling and days 7, 14, 21, and 28 after modeling (N = 24/12); (c) Nissl staining analysis of the neuronal damage in the spinal cord tissues of each group of rats on days 7 and 28 after modeling and the number of Nissl stained-neurons in the spinal cord; (d) HE staining of the pathological changes in the spinal cord of each group of rats on days 7 and 28 after modeling; (e) ELISA analysis of the protein content of IL-6, IL-1β, TNF-α and IL-10 in the spinal cord of each group of rats on days 7 and 28 after modeling; (f) Western blot analysis of the expression of iNOS and Arg1 in the spinal cord of each group of rats on days 7 and 28 after modeling. N = 6. Data are expressed as mean ± standard deviation, and analyzed using one-way ANOVA and Tukey’s multiple comparisons test, *p < 0.05, **p < 0.01
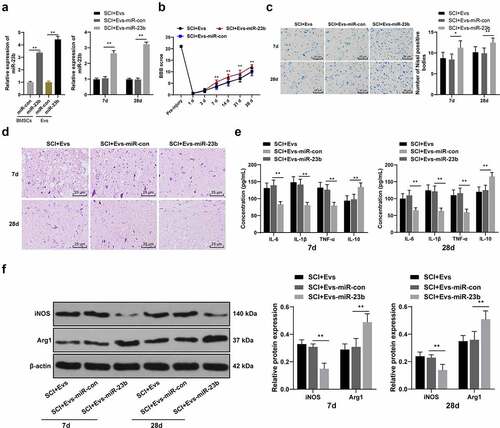
Figure 4. EV-miR-23b inhibits inflammation response in BV2 cells. (a) RT-qPCR analysis of miR-23b expression in BV2 cells; (b) MTT assay for BV2 cell viability; (c) ELISA for IL-6, IL1β, TNFα, and IL10 protein concentration in BV2 cells; (d) Western blot analysis for iNOS and Arg1 protein expression in BV2 cells. The cell experiment was repeated three times. Data are expressed as mean ± standard deviation and analyzed using one-way ANOVA and Tukey’s multiple comparisons test, *p < 0.05, **p < 0.01
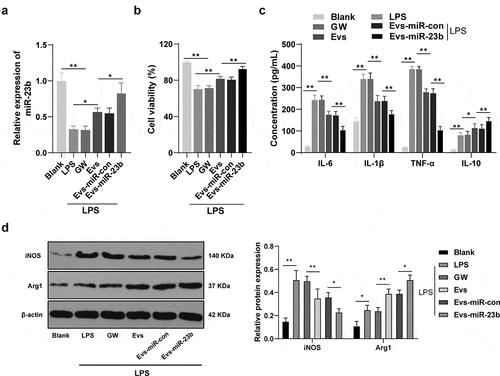
Figure 5. EV-miR-23b targets TLR4 and inactivates the NFκB pathway. (a) Dual luciferase detection of the targeting relationship between miR-23b and TLR4; (b) Western blot analysis of p65 and TLR4 protein levels in spinal cord tissues of rats and p-p65 level in nuclei on day 7 after SCI modeling, N = 6; (c) Western blot analysis of p65 and TLR4 protein levels in BV2 cells and p-p65 level in nuclei 24 hours after co-intervention of LPS and EVs. The cell experiment was repeated three times. Data are expressed as mean ± standard deviation, and comparisons among groups were analyzed using one-way ANOVA and Tukey’s multiple comparisons test, *p < 0.05, **p < 0.01
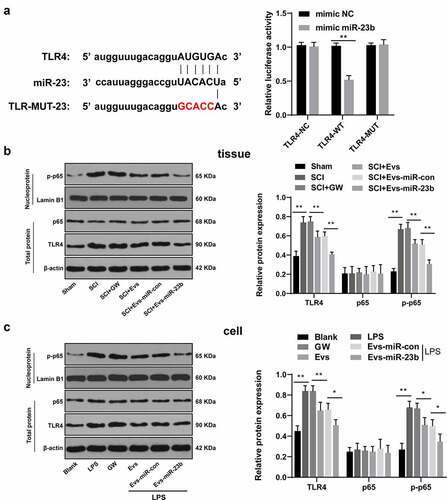
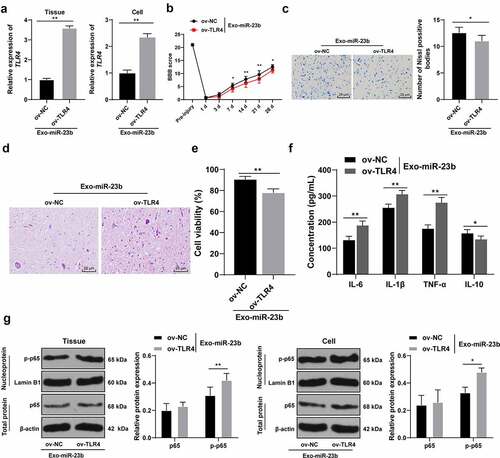
Figure 6. EV-miR-23b inhibits the TLR4/NFκB pathway activation in SCI. (a) RT-qPCR for the expression of TLR4 mRNA in rats and cells in the ov-NC+EVs-miR-23b and ov-TLR4+ EVs-miR-23b groups; (b) Motor recovery of hindlimbs of SCI rats assessed by BBB scoring at before modeling and days 1, 3, 7, 14, 21, and 28 after modeling (N = 12); (c) Nissl staining analysis of the neuronal damage in the spinal cord tissues of each group of rats on days 7 and 28 after modeling and the number of Nissl stained-neurons in the spinal cord; (d) HE staining of the pathological changes in the spinal cord of each group of rats on day 28 after modeling; (e) MTT assay for BV2 cell viability; (f) ELISA for changes in IL-6, IL-1β, TNF-α, and IL-10 protein content in each group; (g) Western blot analysis was used to detect the expression of p65 in spinal cord tissues and cells and p-p65 in nuclei. N = 6. The cell experiment was repeated three times. Data are expressed as mean ± standard deviation, and comparisons in figure A/C/E were analyzed using the t test, and comparisons in figure B/F/G/H were analyzed using one-way ANOVA and Tukey’s multiple comparisons test, *p < 0.05, **p < 0.01