Figures & data
Figure 1. Expression of miR-15a-5p is upregulated during osteogenic differentiation in MC3T3-E1
a: Expression of miR-15a-5p in human osteoporosis specimens. b: Cell viability of MC3T3-E1 cells induced with osteogenic media. c-e: Relative mRNA (c), and protein (d) expression along with quantification (e) of ALP, OCN and RUNX2 genes detected in MC3T3-E1 induced with osteogenic media through RT-qPCR and Western blot. f: Relative activity of ALP in MC3T3-E1 induced with osteogenic media. G: Relative miR-15a-5p expression in MC3T3-E1 induced with osteogenic media. (Data presented as means ± SEM; *p < 0.05, **p < 0.01)
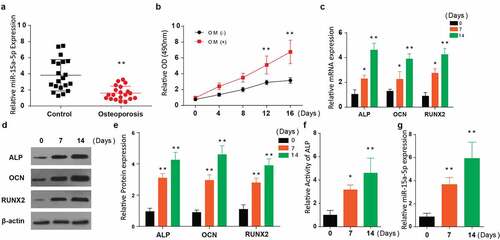
Figure 2. Overexpression of miR-15a-5p promotes osteogenic differentiation
a: Expression of miR-15a-5p in MC3T3-E1 after transfection of miR-15-a-5p mimics and inhibitors. b: Relative mRNA expression of ALP, OCN and RUNX2 genes detected in MC3T3-E1 cells after transfection of miR-15-a-5p mimics and inhibitors. c: Relative activity of ALP in MC3T3-E1 cells after transfection of miR-15-a-5p mimics and inhibitors. d: Alizarin Red staining of MC3T3-E1 cells after transfection of miR-15-a-5p mimics in presence of general media. e: Alizarin Red staining of MC3T3-E1 cells after transfection of miR-15-a-5p mimics and inhibitors in the presence of osteogenic media. (Data presented as means ± SEM; **p < 0.01)
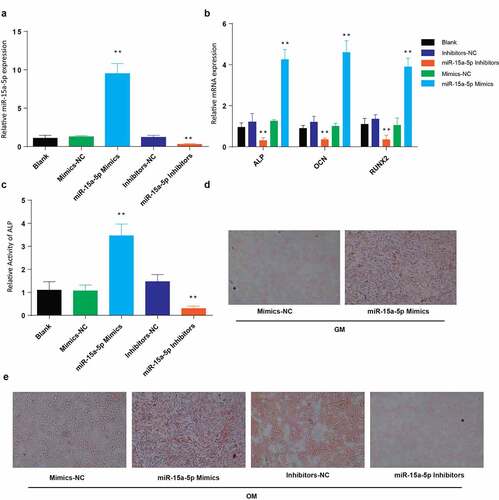
Figure 3. MiR-15a-5p targets 3ʹUTR of PDCD4 and regulate osteogenic differentiation
a: Binding site of mutant and wild type 3ʹUTR of PDCD4 compared to the miR-15a-5p. b: Relative luciferase activity to represent the binding of miR-15a-5p and 3ʹUTR of PDCD4. C: Relative mRNA expression of PDCD4 in MC3T3-E1 cells after transfection of miR-15-a-5p mimics and inhibitors. d-e: Relative protein expression of PDCD4 in MC3T3-E1 cells after transfection of miR-15-a-5p mimics and inhibitors. f: Relative PDCD4 mRNA expression in MC3T3-E1 induced with osteogenic media. g: Relative PDCD4 mRNA expression in MC3T3-E1 cells after transfection of si-PDCD4. h: Relative mRNA expression of ALP, OCN and RUNX2 genes detected in MC3T3-E1 cells after transfection of si-PDCD4. I: Western blot showing expression of PDCD4, ALP, OCN and RUNX2 proteins in MC3T3-E1 cells after transfection of si-PDCD4. j: Relative ALP activity in MC3T3-E1 cells after transfection of si-PDCD4. k: Alizarin Red staining of MC3T3-E1 cells after transfection of si-PDCD4. (Data presented as means ± SEM; **p < 0.01)
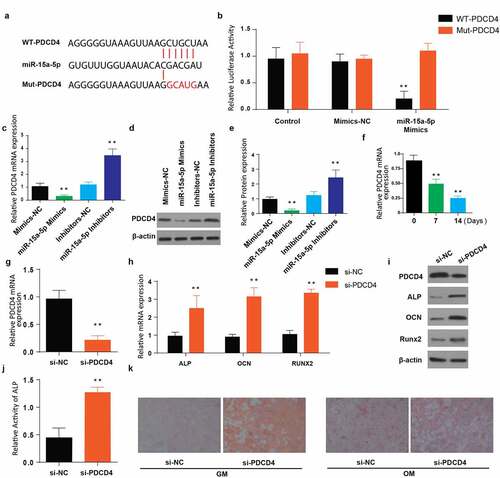
Figure 4. Overexpression of miR 15a 5p attenuates the effects of PDCD4 overexpression in osteogenic differentiation of MC3T3-E1 cells
a: Relative mRNA expression of PDCD4 in MC3T3-E1 cells after co-transfection of miR-15-a-5p mimics and PDCD4 overexpression plasmid. b: Relative mRNA expression of ALP, OCN and RUNX2 genes detected in MC3T3-E1 cells after co-transfection of miR-15-a-5p mimics and PDCD4 overexpression plasmid. c-d: Relative protein expression of ALP, OCN and RUNX2 genes detected in MC3T3-E1 cells after co-transfection of miR-15-a-5p mimics and PDCD4 overexpression plasmid. e: Relative activity of ALP in MC3T3-E1 cells after co-transfection of miR-15-a-5p mimics and PDCD4 overexpression plasmid. f: Alizarin Red staining of MC3T3-E1 cells after co-transfection of miR-15-a-5p mimics and PDCD4 overexpression plasmid. (Data presented as means ± SEM; **p < 0.01)
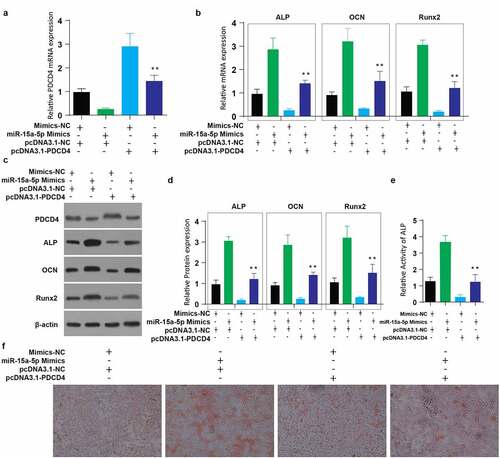
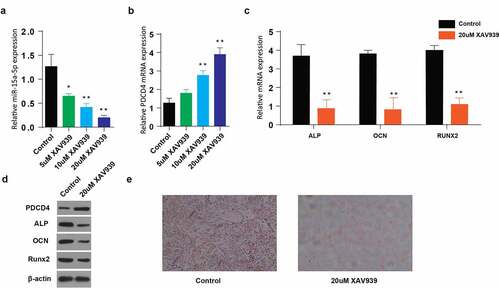
Figure 5. Use of Wnt pathway inhibitors (XAV939) decreases osteogenic differentiation of MC3T3-E1 cells in miR-15a5p/PDCD4/Wnt-dependent signaling pathway
a: Relative miR-15a-5p expression in MC3T3-E1 cells stimulated with different doses of XAV939. b: Relative mRNA expression of PDCD4 in MC3T3-E1 cells stimulated with different doses of XAV939. c: Relative mRNA expression of ALP, OCN and RUNX2 genes detected in MC3T3-E1 cells stimulated with XAV939. d: Western blot showing expression of PDCD4, ALP, OCN and RUNX2 proteins in MC3T3-E1 cells stimulated with XAV939. E: Alizarin Red staining of MC3T3-E1 cells after stimulation with XAV939. (Data presented as means ± SEM; **p < 0.01)