Figures & data
Figure 1. A flow chart outlining the development of multi-gene prognostic signatures pertaining to chemoresistant breast cancerpatient prognosis, including data collection, preprocessing, analysis, and validation
Figure 2. Identifying genes that exhibited differential expression. (a) A volcano plot showing the expression difference between chemosensitive and chemoresistant breast cancer patients. Red color is representative of expression that was up-regulated, and green color represents expression that was down-regulated. (b) The heatmap of the patients with chemosensitivity of breast cancer as compared to samples that were normal. A cutoff with absolute value of log2FC > 1 as well as an FDR < 0.05 was utilized for defining genes that exhibited differential expression
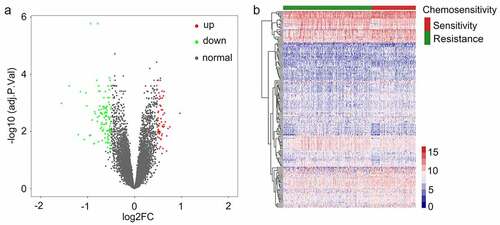
Figure 3. Analysis related to functional enrichment in the context of GO biologic processes as well as KEGG pathway enrichment of differentially expressed genes (DEGs). (a) DEG analyses via KEGG enrichment (every KEGG pathway that was significant). (b) DEG analyses based on GO terms enrichment (the top ten terms are described in every GO category). KEGG as well as GO analysis was conducted with the use of the online instrument known as DAVID, and the cutoff criteria with regards to FDR was less than 0.05. The color that is associated with each of the bubbles is representative of the FDR in relation to that specific term, with the color red being representative of significance that was greater. The proportion of genes that are enriched for every term is referred to via the rich factor
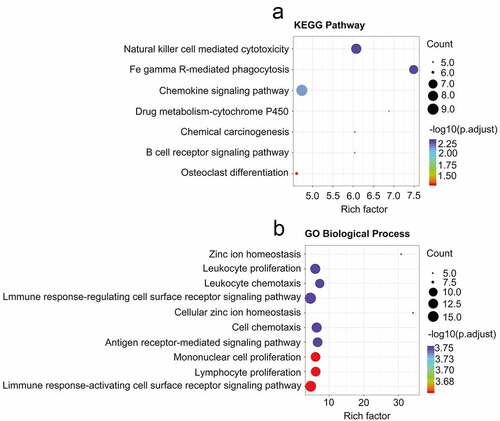
Figure 4. Identifying modules that are linked to the chemosensitivity status of cancer of the breast within the WGCNA. (a) The fit index that was scale-free for powers that involve soft-thresholding. Determination of the power involving soft-thresholding within the WGCNA was accomplished on the basis of a R2 that was scale-free (specifically R2 = 0.95). The panel at the top illustrates the association that exists between soft-threshold as well as scale-free R2. The panel at the bottom illustrates the association between mean connectivity as well as the soft-threshold. (b) A dendrogram depicting the genes that exhibited differential expression clustered on the basis of metrics that are different. Every branch within the figure is representative of one gene, and each color underneath is representative of one module of co-expression. (c) A heatmap that depicts the correlation that exists with regards to the gene module as well as clinical attributes. The brown module was composed of 338 DEGs while the blue module was composed of 360 DEGs. The coefficient of correlation within each cell is representative of the correlation that exists between the chemosensitive phenotype and the gene module, increasing in size from blue to red. The blue module demonstrated a positive correlation that was highest with regards to survival whereas the red module demonstrated the negative correlation that was the highest with regards to survival. (d) Distributive pattern of average gene-based significance as well as errors within the modules related to DFS in CRBC. On the basis of the hierarchical clustering with average linkage as well as the power involving soft-thresholding, the identification of eight modules was subsequently accomplished. To facilitate the determination of the significance associated with every module, gene significance (or GS) was ascertained for measuring the correlation that exists between chemosensitive phenotype and genes. GS was given the definition of a log10 conversion directed at the p-value in the context of the linear regression between clinical data and gene expression (i.e. GS = lgP). The module that is brown and blue exhibited a high degree of correlation with survival in patients who had CRBC. GSEA results showed that there was a positive enrichment of two immune related terms in the 201 genes associated with patient disease-free survival (e and f)
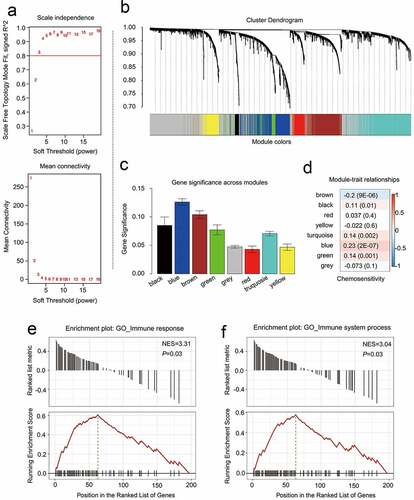
Figure 5. The multi-genes prognostic signature in relation to predicting survival of CRCB patients in the dataset for training. (a) Partial likelihood deviance versus log (λ) was drawn using LASSO-Cox regression model. (b) Coefficients of selected features are shown by lambda parameter. (c) Kaplan-Meier curves related to survival overall between high-risk patients and low-risk patients in the dataset for training. (d) ROC curve associated with the prediction of survival involving multi-genes prognostic signature within a period of five years considered as the training dataset defining point. (E, F, G) The distributive pattern of the three-gene risk scores, overall survival in patients as well as heatmap associated with the three-gene profiles of expression within the dataset for training
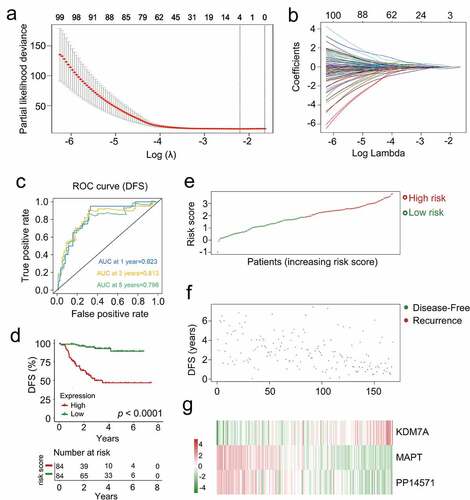
Figure 6. The multi-genes prognostic signature in the prediction of survival in patients who had CRCB within the training dataset. (a) Kaplan-Meier curves related to overall survival between high-risk patients and low-risk patients within the dataset for training. (b) ROC curve in relation to predicting survival via the multi-genes prognostic signature within a period of five years considered as the training dataset defining point. (C, D, E)The distributive pattern of the three-gene risk scores, overall survival in patients as well as heatmap of four-gene profiles of expression within the dataset for training
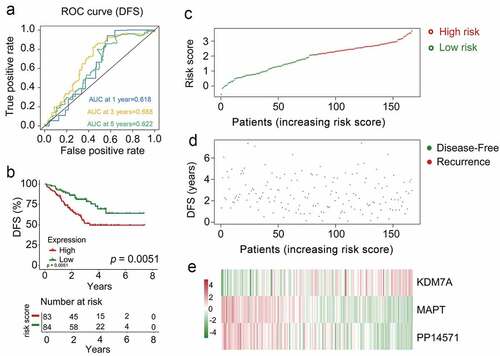
Figure 7. Analysis of survival in all patients who had CRCB stratified on the basis of patient age, staging, subtype of tumor along with the multi-genes prognostic signature. (a) The Kaplan-Meier curves with regards to the dataset that was younger (specifically, age < 50, where n = 86). (b) Kaplan-Meier curves in relation to the dataset that was older (specifically, age ≥ 50, where n = 148). (c) Kaplan-Meier curves with regards to the dataset related to early stage (specifically stage II/III, where n = 156). (d) Kaplan-Meier curves in relation to the dataset with regards to late stage (specifically, stage IV, where n = 78). (e) Kaplan-Meier curves in relation to the non-papillary dataset (that is, subtype of non-papillary, where n = 165). (f) Kaplan-Meier curves in relation to the papillary dataset (that is, subtype of papillary, where n = 69)
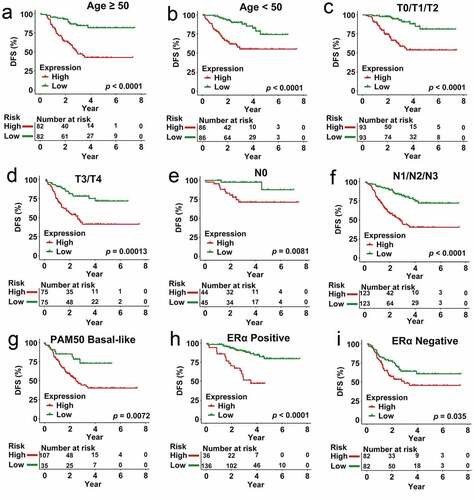
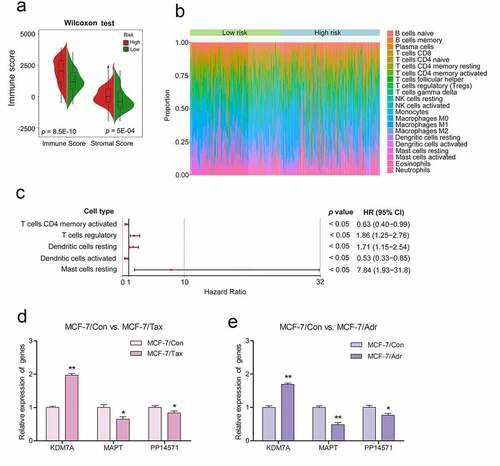
Figure 8. Differences observed when comparing infiltration by immune cells and 22 immune cell subtypes between high-risk CRBC patients and those of a low risk