Figures & data
Table 1. Clinical and pathological characteristics of subjects
Table 2. List of RT-qPCR primers
Figure 1. CircPIP5K1A knockdown inhibits EM progression in vitro. (a) Relative expression levels of circPIP5K1A in normal, euEM and ecEM tissues by RT-qPCR (n = 28). (b) Relative expression levels of circPIP5K1A in hESC cells and hEM15A cells by RT-qPCR. (c) The knockdown efficiency of si-circPIP5K1A#1 and si-circPIP5K1A#2 was assessed by RT-qPCR in hEM15A cells. (d) CCK-8 assay was performed to identify the effect of circPIP5K1A inhibition on proliferative ability of hEM15A cells. (e and f) flow cytometry assays were performed to analyze cell-cycle regulation and cell apoptosis in hEM15A cells. (g) The expression levels of cell cycle-related proteins (CDK2, CDK4, CDK6, and cyclin D1) were detected by western blotting. (h) The expression levels of apoptosis-associated proteins (Bcl-2, Bax, and cleaved Caspase-3) were detected by western blotting. (i and j) wound healing and transwell assays were performed to identify the migrative and invasive ability of hEM15A cells. (k) The expression levels of EMT-related proteins (N-cadherin, vimentin, and E-cadherin) were detected by western blotting. Data are shown as mean ± SD; *P < 0.05, **P < 0.01
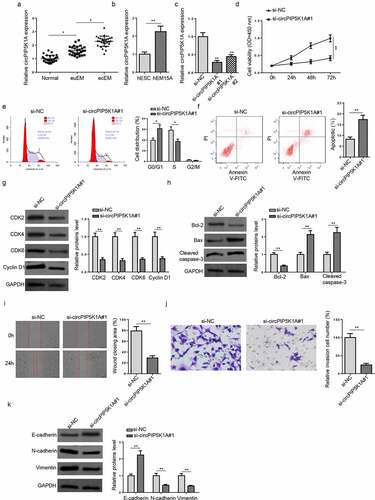
Figure 2. CircPIP5K1A sponges miR-153-3p in EM cells. (a) Relative expression of 8 miRNAs in hEM15A cells after circPIP5K1A knockdown. (b) Relative expression levels of miR-153-3p in normal, euEM and ecEM tissues by RT-qPCR (n = 28). (c) Relative expression levels of miR-153-3p in hESC cells and hEM15A cells by RT-qPCR. (d) The molecular binding site between miR-153-3p and circPIP5K1A-WT or circPIP5K1A-MUT. (e) Dual-luciferase reporter assays confirmed the combination between circPIP5K1A and miR-153-3p. (f) The interaction between circPIP5K1A and miR-153-3p was further confirmed by RIP assay. (g) CircPIP5K1A overexpression efficiency in hEM15A cells was assessed by RT-qPCR. (h) miR-153-3p expression in hEM15A cells transfected with vector or oe-circPIP5K1A was detected by RT-qPCR. Data are shown as mean ± SD; *P < 0.05, **P < 0.01, ***P < 0.001
Figure 3. miR-153-3p inhibition reverses EM phenotypes induced by circPIP5K1A silencing in vitro. (a) The knockdown efficiency of miR-153-3p was assessed by RT-qPCR in hEM15A cells. (b) hEM15A cells were transfected with si-NC, si-circPIP5K1A#1, si-circPIP5K1A#1+ NC inhibitor, or si-circPIP5K1A#1+ miR-153-3p inhibitor. Then, CCK-8 assay was performed to analyze the proliferative ability of hEM15A cells. (c and d) flow cytometry assays were performed to analyze cell-cycle regulation and cell apoptosis in hEM15A cells. (e and f) wound healing and transwell assays were performed to analyze the migrative and invasive ability of hEM15A cells. Data are shown as mean ± SD; *P < 0.05, **P < 0.01
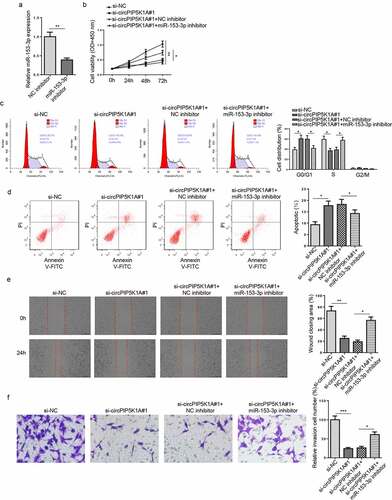
Figure 4. CircPIP5K1A regulates TMSB4X expression in EM cells as a sponge for miR-153-3p. (a) The target genes of miR-153-3p were predicted by 3 databases (miRmap, PITA, and PicTar). (b) Relative mRNA levels of TMSB4X in normal, euEM and ecEM tissues by RT-qPCR (n = 28). (c) Relative mRNA levels of TMSB4X in hESC cells and hEM15A cells by RT-qPCR. (d) The molecular binding site of miR-153-3p and TMSB4X-WT or TMSB4X-MUT. (e) Dual-luciferase reporter assays confirmed the combination between miR-153-3p and TMSB4X. (f) The interaction between miR-153-3p and TMSB4X was further confirmed by RIP assay. (g) MSB4X mRNA expression was evaluated by RT-qPCR in hEM15A cells respectively transfected with NC mimics, miR-153-3p mimics, NC inhibitor, miR-153-3p inhibitor. (h) TMSB4X mRNA expression was evaluated by RT-qPCR in hEM15A cells respectively transfected with si-NC, si-circPIP5K1A#1, si-circPIP5K1A#1+ NC inhibitor, or si-circPIP5K1A#1+ miR-153-3p inhibitor. (i) TMSB4X mRNA expression was evaluated by RT-qPCR in hEM15A cells respectively transfected with NC inhibitor, miR-153-3p inhibitor, miR-153-3p inhibitor+si-NC, or miR-153-3p inhibitor+si-circPIP5K1A#1. Data are shown as mean ± SD; *P < 0.05, **P < 0.01
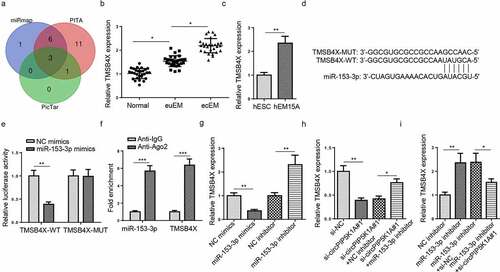
Figure 5. TMSB4X overexpression abrogates the effects of circPIP5K1A deletion on EM progression in vitro. (a) The overexpression efficiency of oe-TMSB4X was assessed by RT-qPCR and Western blotting in hEM15A cells. (b) hEM15A cells were respectively transfected with si-NC, si-circPIP5K1A#1, si-circPIP5K1A#1+ vector, si-circPIP5K1A#1+ oe-TMSB4X. Then, CCK-8 assay was performed to analyze proliferative ability of hEM15A cells. (c and d) Flow cytometry assays were performed to analyze cell-cycle regulation and cell apoptosis in hEM15A cells. (e and f) wound healing and transwell assays were performed to analyze the migrative and invasive ability of hEM15A cells. Data are shown as mean ± SD; *P < 0.05, **P < 0.01
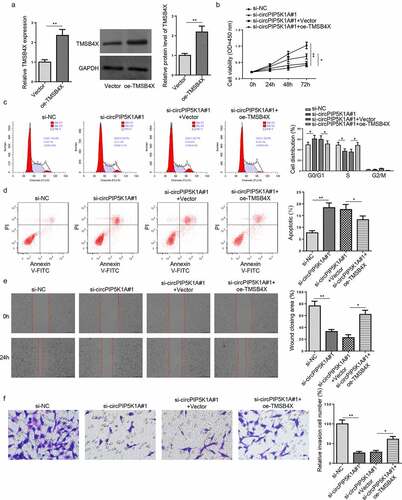
Figure 6. TMSB4X activates TGF-β signaling pathway in hEM15A cells. (a) The knockdown efficiency of si-TMSB4X was assessed by RT-qPCR and Western blotting in hEM15A cells. (b and c) RT-qPCR and western blotting showed the expression levels of TGF-β2 in hEM15A cells transfected with si-NC, si-TMSB4X, vector, or oe-TMSB4X. Data are shown as mean ± SD; **P < 0.01