Figures & data
Figure 1. LINC02570 is upregulated in late clinical stage NPC patients. (a) LINC02570 expression in NPC patients in early or late clinical stages. *p < 0.05. (b) LINC02570 expression in NPC patients with non-advanced or advanced lymph node metastatic disease. (c) Kaplan-Meier analysis of overall survival (OS) among NPC patients with high or low LINC02570 expression. (d) Kaplan-Meier analysis of disease-free survival (DFS) among NPC patients with high or low LINC02570 expression. *p < 0.05
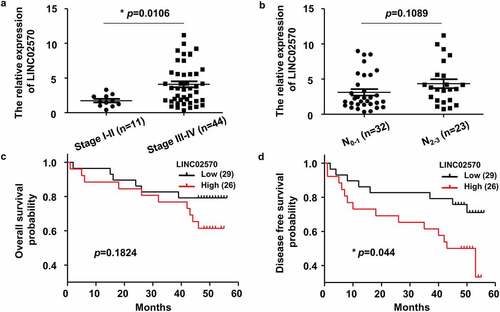
Figure 2. Stable overexpression/knockdown, and LINC02570 location in NPC cell lines. (a) LINC02570 expression in NPC cell lines and a nasopharyngeal epithelial cell line. NP69 was a noncancerous control for NPC cell lines. (b) LINC02570 expression was stably up-regulated. 6–10B and NC-6-10B were controls relative to OE-6-10B. (c) LINC02570 was transiently knocked down in 5–8 F. 5–8 F and 5–8 F NC were considered control samples for 5–8 F KD-1#, 2# and 3#. (d) LINC02570 was stably knocked down. 5–8 F and NC-5-8 F were control samples for KD-5-8 F. (e) LINC02570 was mainly located in cytoplasm (magnification: 400x). **p < 0.01, ***p < 0.001
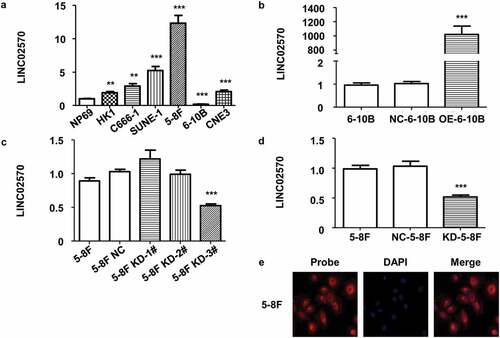
Figure 3. Stable LINC02570 knockdown attenuated proliferation, migration, invasion and viability of NPC cells. (a) Proliferation of NC-5-8 F and KD-5-8 F cells was detected by colorimetric focus-formation assay. (b) Migration of NC-5-8 F and KD-5-8 F cells was detected by wound healing assay (magnification: 40x). Stably transfected cells displayed green fluorescence. (c) Migration and invasion of NC-5-8 F and KD-5-8 F were detected by transwell assays (magnification: 200x). (d) NC-5-8 F and KD-5-8 F cell viability was detected by MTT. *p < 0.05, **p < 0.01, ***p < 0.001
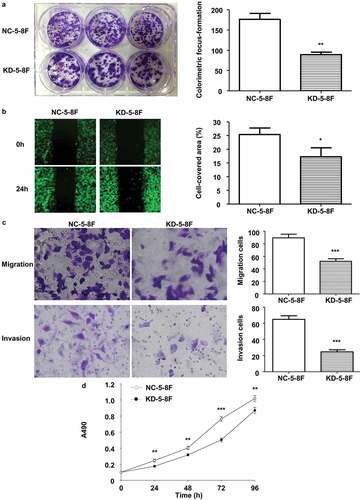
Figure 4. Stable LINC02570 overexpression enhanced NPC cell proliferation, migration, invasion and viability. (a) Proliferation of NC-6-10B and OE-6-10B cells was detected by colorimetric focus-formation assay. (b) Migration of NC-6-10B and OE-6-10B cells was detected by wound healing assay (magnification: 40x). Stably transfected cells didn’t show any fluorescence. (c) NC-6-10B and OE-6-10B cell migration and invasion were detected by transwell assays (magnification: 200x). (d) NC-6-10B and OE-6-10B cell viability was detected by MTT. *p < 0.05, **p < 0.01, ***p < 0.001
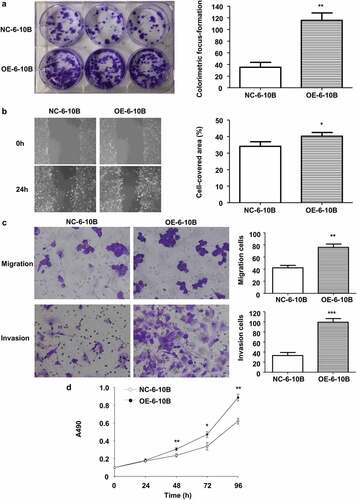
Figure 5. SREBP1 and FASN expression in stably transfected 6–10B and 5–8 F cells. (a) SREBF1 and FASN mRNA levels were detected by qPCR. (b) and (c) SREBP1 and FASN protein levels were detected by western-blot. SREBF1 refers to the transcript encoding SREBP1. 6–10B and NC-6-10B were control samples for OE-6-10B. 5–8 F and NC-5-8 F were control samples for KD-5-8 F. **p < 0.01, ***p < 0.001
Figure 6. LINC02570 promotes NPC progression through the miR-4649-3p/SREBP1/FASN axis. (a) Bioinformatics analysis predicted miR-4649-3p binding sites on LINC02570 and SREBF1. (b) Luciferase activities of 5–8 F cells co-transfected with LINC02570 wild-type (WT)/mutant (Mut) or SREBF1 WT/Mut +miR-4649-3p mimic or mimic NC were respectively analyzed by dual luciferase reporter assay. (c) SREBP1 and FASN protein levels were detected by western blotting. (d) and (e) Viability and migration were detected by MTT and transwell assays. *p < 0.05, **p < 0.01, ***p < 0.001