Figures & data
Figure 1. Downregulation of DUSP14 was confirmed in OA rats and IL-1β-stimulated chondrocytes. (a, b) The articular cartilage tissues were collected from ACLT-induced OA rats. Then, the mRNA (a) and protein (b) levels of DUSP14 were determined by qRT-PCR and western blotting. (c, d) Chondrocytes were treated with IL-1β for 24 h. Then, the mRNA (c) and protein (d) expression of DUSP14 were analyzed. n = 3. *P < 0.05 vs. control group
Figure 2. Elevation of DUSP14 antagonized IL-1β-evoked inflammatory injury in chondrocytes. (a) The effects of LV-DUSP infection were evaluated by western blotting. n = 3. (b, c) Before exposure to IL-1β, chondrocytes were treated with LV-DUSP14 vectors. Then, cell viability (b) and apoptosis (c) were analyzed by MTT and flow cytometer. n = 3. (d-g) The levels of inflammatory mediator NO and PGE2 and pro-inflammatory cytokines (IL-6 and TNF-α) were determined by the commercial kits. n = 4. *P < 0.05 vs. control group. §P < 0.05 vs. IL-1β-treated group
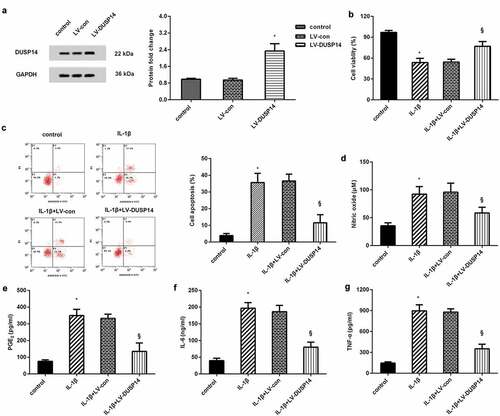
Figure 3. DUSP14 affected metabolic disorders in IL-1β-treated chondrocytes. (a) Cells were treated with LV-DUSP14 prior to IL-1β stimulation. Then, the mRNA levels of MMP-3 and MMP-13 were detected by qRT-PCR. n = 4. (b, c) The releases of MMP-3 (b) and MMP-13 (c) from chondrocytes were analyzed by ELSIA kits. n = 4. (d-f) The effects of DUSP14 overexpression on the mRNA (d) and protein expression (e, f) of ADAMTS5, collagen II and aggrecan were further evaluated. n = 4. *P < 0.05 vs. control group. §P < 0.05 vs. IL-1β-treated group
Figure 4. DUSP14 regulated the AMPK/IκB/NF-kB signaling in IL-1β-simulated chondrocytes. (a) After infection with LV-DUSP14 plasmids, cells were exposed to IL-1β. Then, western blotting was performed to determine the protein levels of p-AMPK, AMPK, IκB-α, p-p65 NF-κB and p65 NF-κB. (b-d) The corresponding protein bands were quantified by ImageJ software. n = 3. *P < 0.05 vs. control group. §P < 0.05 vs. IL-1β-treated group
Figure 5. The AMPK/IκB/NF-kB signaling mediates chondroprotective efficacy of DUSP14 elevation. (a, b) After transfection with si-AMPK, the activation of the AMPK/IκB/NF-kB signaling was analyzed. n = 3. (c, d) Cells were treated with si-AMPK, LV-DUSP14 and IL-1β. Then, cell viability (c) and apoptosis (d) were determined. n = 4. (e-i) The subsequent efficacy on NO (e), PGE2 and TNF-α (f), IL-6 (g), MMP production (h) and other metabolism-related protein expression (i) were assessed. n = 3.*P < 0.05 vs. control group. §P < 0.05 vs. IL-1β-treated group. &P < 0.05 vs. IL-1β and LV-DUSP14 group
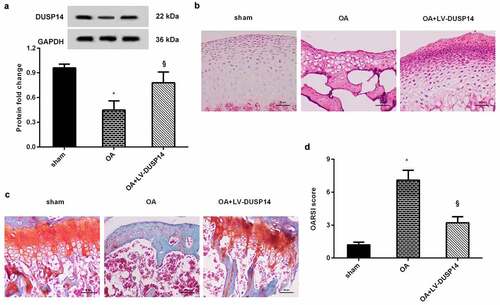
Figure 6. Elevation of DUSP14 alleviated OA progression in vivo. (a) Rats underwent ACLT were injected with LV-DUSP14 plasmids. Then, the protein expression of DUSP14 in articular cartilage was detected by western blotting. (b-d) Subsequently, histological assay was conducted by HE (b), Safranin O staining (c) and OARSI scores (d). n = 10 rats in each group. *P < 0.05 vs. sham group. §P < 0.05 vs. OA group