
Figures & data
Table 1. Correlation between miR-652-3p expression levels and clinical features in HCC patients
Figure 1. RT-qPCR assay discovered the levels of miR-652-3p in HCC tissues and cells. a. The levels of miR-652-3p were significantly increased in HCC tissues (***P < 0.001). b. Expression of miR-652-3p in HCC and human normal hepatocytes. Compared with normal cells, miR-652-3p was elevated in HCC cells (**P < 0.01)
Table 2. Multivariate Cox analysis of miR-652-3p and clinical parameters with overall survival
Figure 2. Compared with HCC patients with low miR-652-3p expression, the prognosis of patients with high miR-652-3p expression was not ideal (log-rank P = 0.007)
Figure 3. The level of miR-652-3p regulates cell proliferation of HCC cells. a. Expression level of miR-652-3p was detected after transfection of miR-652-3p mimics and inhibitors. (**P < 0.01). b. CCK-8 assay to detect the regulation of miR-652-3p on proliferation (*P < 0.05). c. Colony formation assay was performed to accessed the regulation of miR-652-3p on colony forming ability (***P < 0.001, compared to mimic NC; ### P < 0.001, compared to inhibitor NC)
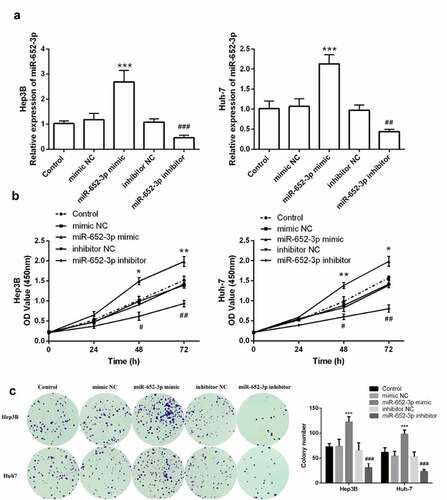
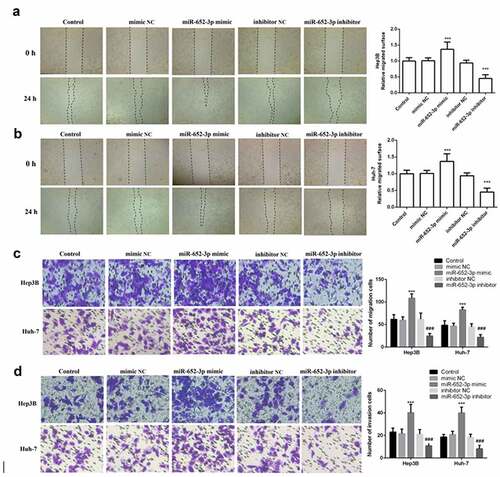
Figure 4. Wound healing and Transwell assay was used to detect cell migration and invasion. a. Wound healing assay was performed to explore the migration of Hep3B. b. Wound healing assay was performed to explore the migration of Huh-7. c. Representative images of miR-652-3p affecting cell migration and statistical results on the number of cell migration. d. Representative images of miR-652-3p affecting cell invasion and statistical results on the number of cell migration (***P < 0.001, compared to mimic NC; ### P < 0.001, compared to inhibitor NC)
Supplemental Material
Download ()Data availability statement
The corresponding author can provide the data of this study if reasonable.