Figures & data
Figure 1. Chemical structure of schisandrin B
Figure 2. Protective effects of schisandrin B on D-galactosamine (D-GalN)-induced cytotoxicity in L02 cells. (a) Cells were treated with D-GalN (0, 1, 5, 10, 20, 40, 80 mM) (b) or schisandrin B (0, 5, 10, 20, 40, 80 μM) for 12 h. (c) Cells were pre-treated with schisandrin B (0, 1, 5, 10, 20, 40 μM) for 12 h followed by D-GalN (40 mM) treatment for 12 h. Cell viability was detected by using the MTT reagent. Data are expressed as mean±SEM. Compared with control, *P < 0.05, **P < 0.01, ***P < 0.001; compared with D-GalN, #P < 0.05, ##P < 0.01, ###P < 0.001
Figure 3. Anti-apoptotic effects of schisandrin B on D-GalN-induced L02 cells. (a) Control group; (b) Cells treated with D-GalN (40 mM) alone; (c) Cells pre-treated with schisandrin B (40 μM) for 12 h and then treated with D-GalN (40 mM) for 12 h; (d) The results of the apoptotic rate. The rate of apoptosis was evaluated by flow cytometry. Data are expressed as mean±SEM. Compared with control, ***P < 0.001; compared with D-GalN, ###P < 0.001
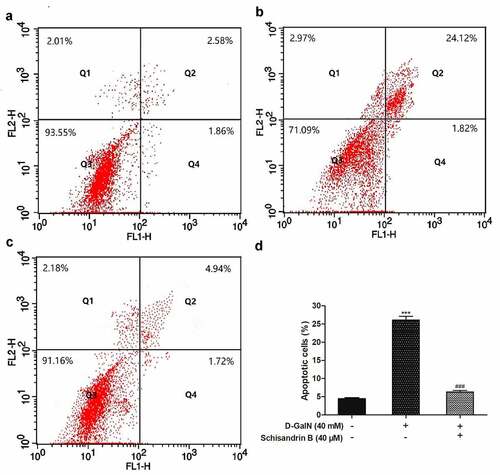
Figure 4. Effects of schisandrin B on oxidative stress indexes in D-GalN-induced L02 cells. (a) The relative SOD activity; (b) The relative GSH-Px activity; (c) The relative MDA content. Data are expressed as mean±SEM. Compared with control, ***P < 0.001; compared with D-GalN, ###P < 0.001
Figure 5. Effects of schisandrin B on the protein expression of Bax and Bcl-2 in D-GalN-induced L02 cells. (a) Representative immunoblots for the Bax and Bcl-2, and GAPDH proteins; (b, c) The relative protein expression levels of Bax/GAPDH, Bcl-2/GAPDH. The data on quantified protein expressions were normalized by related GAPDH (fold change of control). The protein expression was detected by Western blot analysis. Data are expressed as mean±SEM. Compared with control, ***P < 0.001; compared with D-GalN, ###P < 0.001
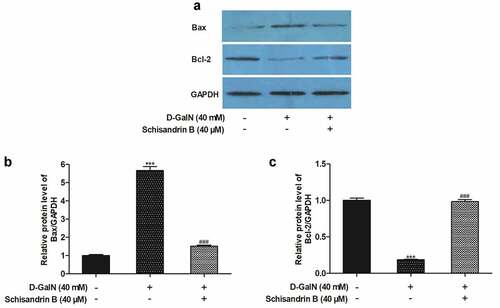
Figure 6. Effects of schisandrin B on the mRNA expression of Bax and Bcl-2 in D-GalN-induced L02 cells. (a) Bax mRNA expression and the ratio to the control level; (b) Bcl-2 mRNA expression and the ratio to the control level; (c) The mRNA expression was detected by RT-PCR; as a loading control, GAPDH was used. Data are expressed as mean±SEM. Compared with control, ***P < 0.001; compared with D-GalN, ###P < 0.001