Figures & data
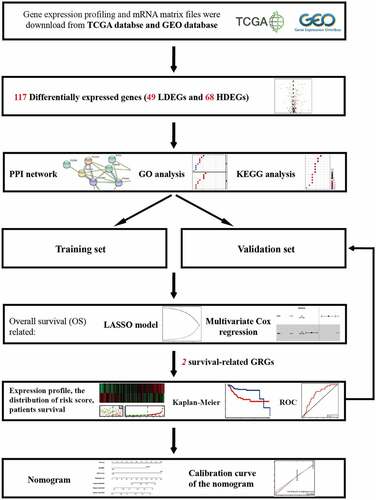
Figure 1. Flowchart of this study
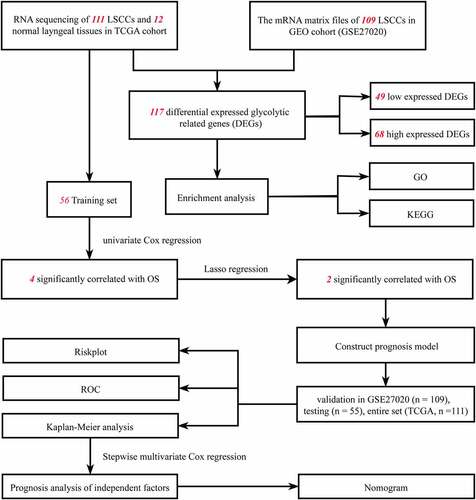
Figure 2. The distribution of DEGs of glycolysis in TCGA dataset. (a) Heatmap of the 117 DEGs was screened out in the 12 normal tissue and 111 carcinomas through GSEA. (b) Volcano plot of the differentially expressed GRGs between tumor specimens and normal laryngeal specimens. The Y-axis represents the adjusted FDR, and the X-axis represents the value of the log fold change (Log FC). Aberrantly expressed GRGs were calculated using the R package. Red dots represent upregulated GRGs in the tumor specimens, whereas green dots indicate downregulated. Black dots presented GRGs without significant differences in these two groups
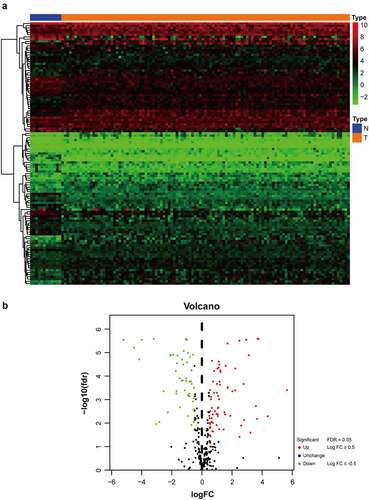
Figure 3. The correlation between molecular process and differential genes in LSCC. In GO analysis, 49 low expressed DEGs (a) and 68 high expressed DEGs (b) were discovered their connection to biological processes (BP), cellular components (CC) and molecular functions (MF). In KEGG analysis, 49 low expressed DEGs (c) and 68 high expressed DEGs (d) were manifested association to suspicious pathway and function. The q-value was deemed as an adjusted p-value, which <0.05 would be considered statistically significant
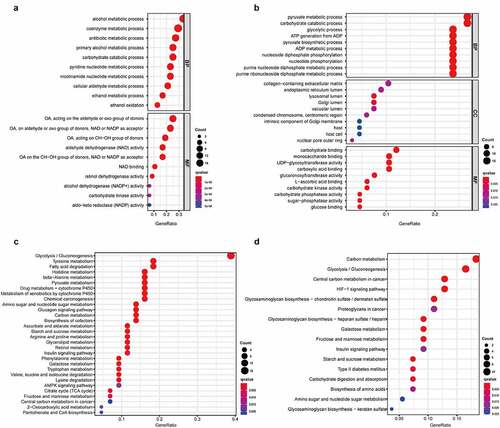
Figure 4. The PPI network of two differential genes and the most frequently altered neighbor genes
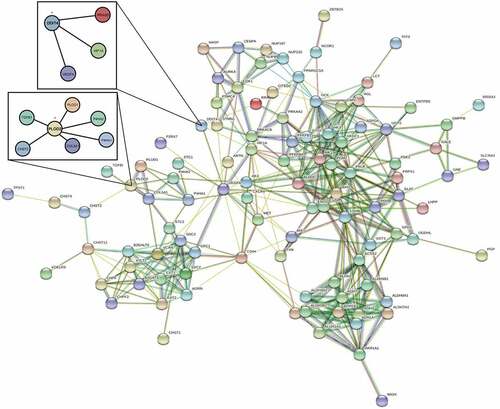
Table 1. Univariate and multivariate Cox regression of prognosis-based GRGs
Figure 5. Prognostic model of the GRGs. (a and b) After screening out from univariate cox regression, the partial likelihood deviation and coefficients were calculated by LASSO. (c) The multivariate cox regression showed only PLOD2 and DDIT4 were enrolled. A p-value <0.05 would be considered statistically significant
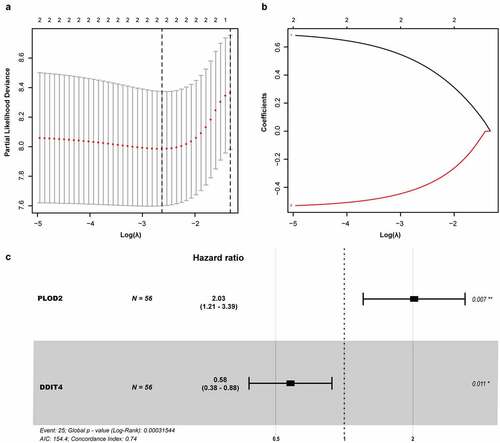
Figure 6. Comparison in stratified with risk signature of the two glycolysis-related hub genes in the training set. (a) PLOD2 showed higher expression in high-risk signature (orange), whereas DDIT4 presents higher in low-risk signature (blue). The distribution of hub genes was marked as a low proportion (green) or high proportion (red), separated by the median (vertical black line). Each point presents their connection with overall survival (b), high- and low-risk score group(c). (d) Number at risk for each stratified risk group over 12-years is processed using Kaplan–Meier method. (e) The efficacy of the risk score in predicting overall survival through ROC curve and the AUC is 0.723
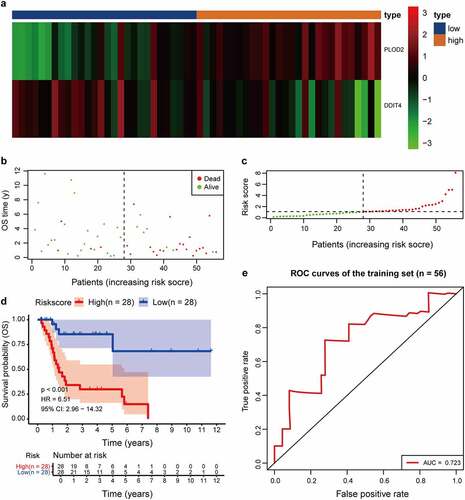
Figure 7. The validation of PLOD2 and DDIT4 in LSCC tissue and their adjacent tissue. (a) The PLOD2 present higher expression in LSCC, compared to their adjacent normal tissue (p = 0.0007). (b) The PLOD2 present higher expression in LSCC, compared to their adjacent normal tissue (p = 0.0385). * means p < 0.05; ** means p < 0.005
Table 2. Univariate and multivariate Cox regression of dependent risk factors
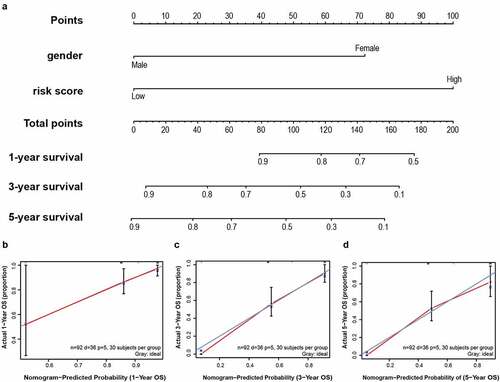
Figure 8. A nomogram was established for predicting 1-, 3- and 5-year OS. (a) Nomogram associated with statistically differentiated 2-mRNA signature and genders to predict short-termed to the long-termed OS in patients with LSCC. (b–d) The calibration curve of the nomogram for the prediction of 1-, 3- and 5-year OS. The blue solid line shows an ideal nomogram and the red solid line indicates the current nomogram. Two lines approach together means the nomogram performed well. Vertical lines represent 95% CI