Figures & data
Figure 1. Celecoxib decreased the severity of NEC in neonatal rats
Note: A, The survival of neonatal rats in each group; B, The weight of neonatal rats in each group; *, P < 0.05 compared with the normal group; #, P < 0.05 compared with the model group; &, P < 0.05 compared with the 0.5 mg/kg celecoxib group; %, P < 0.05 compared with the 1 mg/kg celecoxib group.
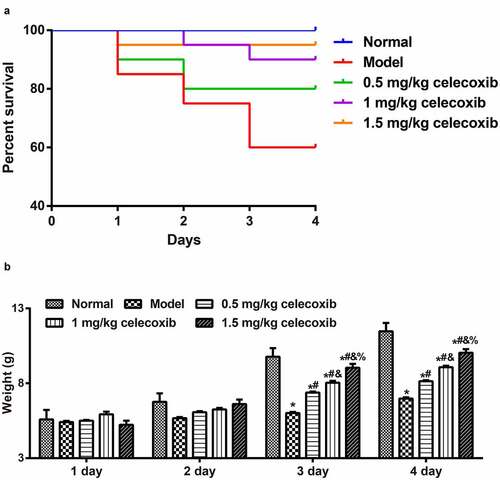
Figure 2. Celecoxib reduced NEC incidence in neonatal rats
Note: A, The histopathological changes of ileum tissues in neonatal rats were evaluated after HE staining; B, The ileum tissue damage was measured via an histological scoring system; C, The incidence of NEC (%) of neonatal rats in each group. *, P < 0.05 compared with the normal group; #, P < 0.05 compared with the model group; &, P < 0.05 compared with the 0.5 mg/kg celecoxib group; %, P < 0.05 compared with the 1 mg/kg celecoxib group.
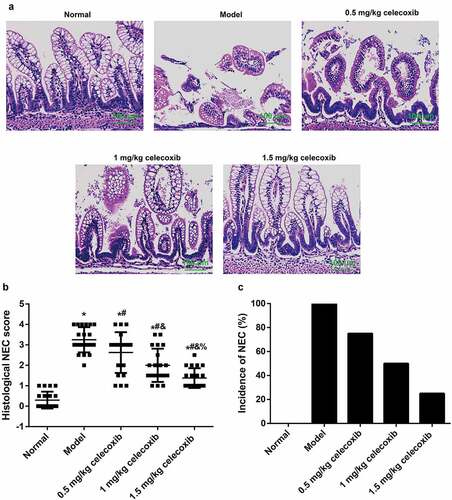
Figure 3. The COX-2 inhibitor celecoxib affected inflammatory factors in the serum and ileum of NEC rats
Note: A-C, The expression of TNF-α (A), INF-γ (B) and IL-10 (C) in serum of neonatal rats determined with ELISA; D-F, The mRNA expression of TNF-α (D), INF-γ (E) and IL-10 (F) in ileum tissues of neonatal rats detected by qRT-PCR; *, P < 0.05 compared with the normal group; #, P < 0.05 compared with the model group; &, P < 0.05 compared with the 0.5 mg/kg celecoxib group; %, P < 0.05 compared with the 1 mg/kg celecoxib group.
Figure 4. The COX-2 inhibitor celecoxib regulated the oxidative stress of ileum in NEC rats
Note: Malondialdehyde (MDA, A), Superoxide dismutase (SOD, B), Glutathione peroxidase (GPx, C), Total oxidant status (TOS, D), Total antioxidant status (TAS, E), Oxidative stress index (OSI, F), OSI = TOS/TAS; *, P < 0.05 compared with the normal group; #, P < 0.05 compared with the model group; &, P < 0.05 compared with the 0.5 mg/kg celecoxib group; %, P < 0.05 compared with the 1 mg/kg celecoxib group.
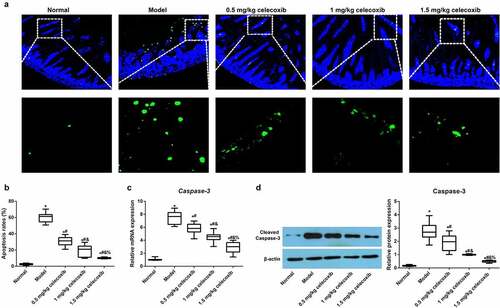
Figure 5. The COX-2 inhibitor celecoxib affected ileal apoptosis in NEC rats
Note: A, Immunofluorescence images of TUNEL (green fluorescence) as an indicator of apoptosis in the ileum of neonatal rats, DAPI (blue staining) served as a counterstain; B, counterstain; B, Comparison of apoptotic rates among groups (B); C, The mRNA expression of Caspase-3 in the ileum quantified by qRT–PCR; D, The protein expression of Cleaved Caspase-3 in the ileum quantified by Western blotting; *, P < 0.05 compared with the normal group; #, P < 0.05 compared with the model group; &, P < 0.05 compared with the 0.5 mg/kg celecoxib group; %, P < 0.05 compared with the 1 mg/kg celecoxib group.